Summary and Setup
This is a new lesson built with The Carpentries Workbench.
This lesson will give you a brief introduction of different techniques and details on how to do data visualizations in R.
Software Setup
Details
To ensure you have the proper environment for creating and customizing graphics in R, it’s essential to set up RStudio correctly. Begin by downloading and installing R from the Comprehensive R Archive Network (CRAN) website, followed by RStudio from the official RStudio website. Choose a CRAN mirror closest to your location and download the appropriate version of R for your operating system (Windows, macOS, or Linux), and follow the installation instructions to complete the setup.
Once installed, launch RStudio and install essential packages through
the console by running
install.packages(c("ggplot2", "dplyr")).
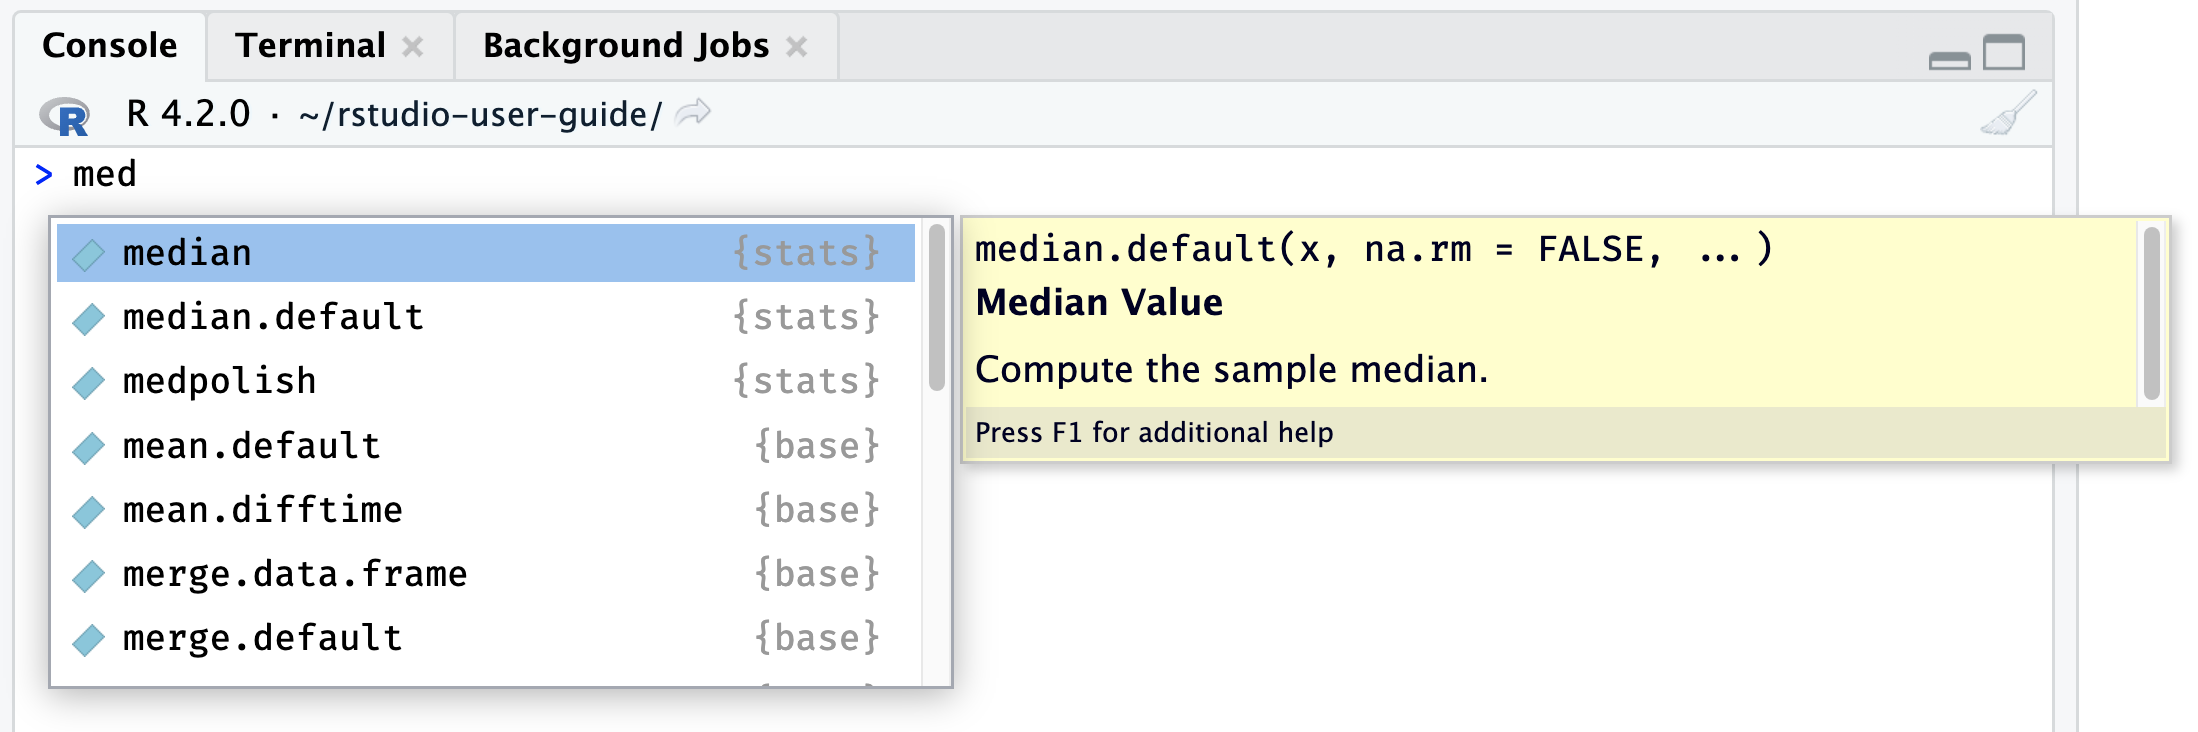
R Console
This should appear on the left corner on your screen inside RStudio.
Set your working directory using
setwd("path/to/your/directory"), and create a new script
file for your projects. Load the necessary libraries at the beginning of
your script with library(ggplot2) and
library(dplyr).
Now, inside this newly created R script, we can begin our lesson.