Low Level Plot Functions
Last updated on 2024-12-24 | Edit this page
Overview
Questions
- How do you create and customize basic plots in R using base graphics?
Objectives
- Understand low-level plotting functions.
- Be able to customize existing plots with low-level plotting functions.
There are numerous low level plot functions in base graphics that add components to an existing plot.
Caution: Low level plot functions can only be used if there is already a plot open. If you run a low level plot command when there is not a plot already open, R will give you an error.
Points
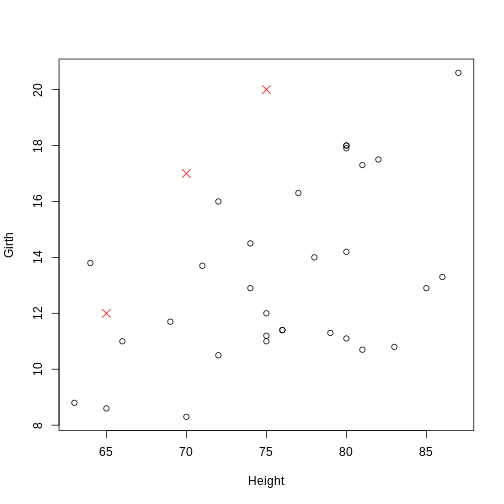
The points() function is used to add points to an
existing plot. Similar to the basic form of plot(), the
syntax is points(x, y, ...), where x and
y are numeric vectors that correspond to the coordinates of
the points to add. The same optional arguments common to
plot() can be used to specify the color, size, and type of
the points. To demonstrate, we again use the built-in trees
data set:
R
plot(Girth ~ Height, data = trees)
points(c(65, 70, 75), c(12, 17, 20), pch = 4, col = "red", cex = 1.5)
 The coordinate pairs can alternatively be specified using a a two-column
matrix or data frame, a list with two components called
The coordinate pairs can alternatively be specified using a a two-column
matrix or data frame, a list with two components called x
and y, or a formula y ~ x.
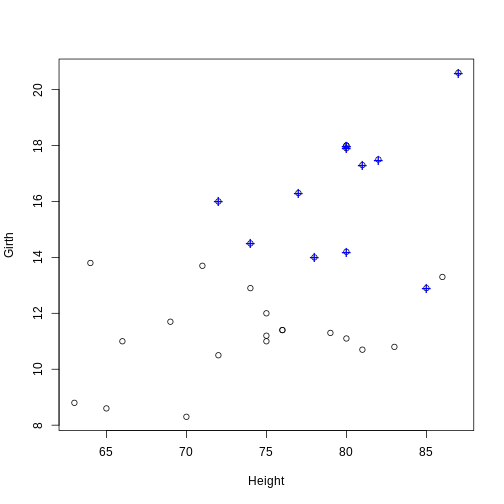
Challenge 1: Can you do it?
Use the points()function to note which trees have an
above average volume.
R
# Find the observations (trees) with an above average (mean) volume
volume_index <- with(trees, Volume > mean(Volume))
# Plot the tree girths against height
plot(Girth ~ Height, data = trees)
# Add a blue + to the observations with an above average volume
points(Girth ~ Height, data = trees[volume_index, ], pch = "+", col = "blue", cex = 1.5)
Lines
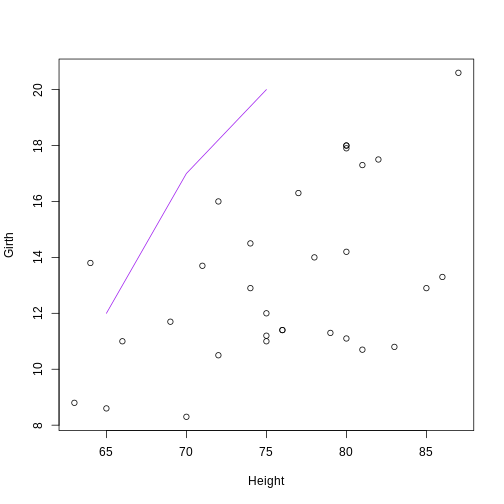
The lines() function is used to add connected line
segments to an existing plot. The syntax is identical to
points(), but the output will connect specified coordinates
by straight line segments.
R
plot(Girth ~ Height, data = trees)
# Self-generated points
coords_mat <- cbind(c(65, 70, 75), c(12, 17, 20))
lines(coords_mat, col = "purple")
 Notice: Even though
 lines() and
points() are separate functions, the functionality of both
are actually the same. The points() function can be used to
add line segments by setting the optional argument
type = "l". The lines() function can be used
to add points by setting the optional argument
type = "p".
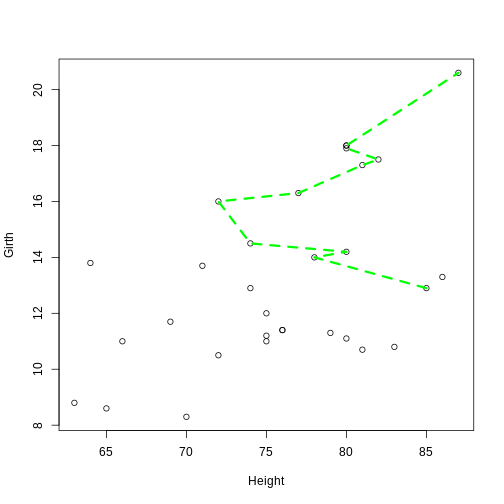
Lines constructed in base graphics functions (like plot() or lines()) can be modified using line-specific optional arguments. Commonly used arguments are:
- lty: The lty argument controls the line type. Line types can either be specified as an integer (0 is blank, 1 is solid (default), 2 is dashed, 3 is dotted, 4 is dotdash, 5 is longdash, and 6 is twodash) or as one of the character values “blank”, “solid”, “dashed”, “dotted”, “dotdash”, “longdash”, or “twodash”, where “blank” uses “invisible lines” (i.e., the lines are not drawn).
-
lwd: The lwd argument controls the line width.
Similar to the cex argument for points, the value corresponds to the
amount by which the line width should be scaled relative to the default
of
lwd = 1. Values above 1 will make the line wider, and values below 1 will make the line thinner.
R
plot(Girth ~ Height, data = trees)
lines(Girth ~ Height, data = trees[volume_index, ], col = "green", lty = 2, lwd = 3)
 Notice:The
 lines() function can also be
used to add a smooth density curve over a relative frequency histogram
(prob = TRUE). The density() function computes a kernel
density estimate of the data, which can be visualized as a smooth curve
superimposed over a histogram using the lines()
function.
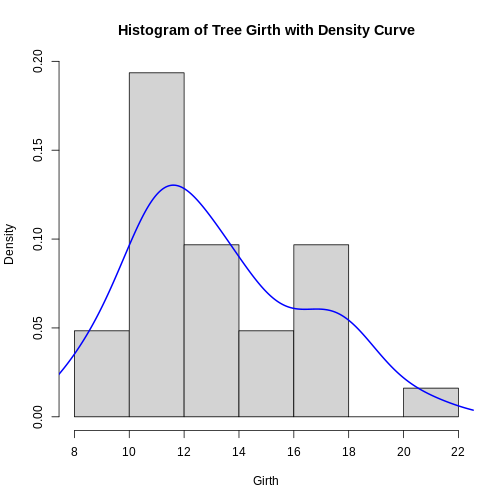
Challenge 2
Can you create a histogram of Girth with relative
frequencies and then use the lines() function to add a
smooth density curve over the histogram?
R
hist(trees$Girth, prob = TRUE, main = "Histogram of Tree Girth with Density Curve", xlab = "Girth")
lines(density(trees$Girth), lwd = 2, col = "blue")
Key Points
- Know how to add points to an existing plot using the points() function
- Know how to add connected line segments to an existing plot using the lines() function
- Understand how to use the lines() function to add points by setting the type argument to “p”
- Learn how to add a smooth density curve over a histogram