Content from Introduction to Qualitative Data
Last updated on 2024-06-21 | Edit this page
Estimated time: 60 minutes
Overview
Questions
- What can we learn from existing qualitative data?
- How is qualitative interview data typically structured?
Objectives
- Appreciate the goals and approach of this lesson
- Identify opportunities and barriers for qualitative data reuse
- Practice finding and downloading data from a qualitative data repository
For decades, a movement has been building among quantitative researchers to share data and analysis as completely as possible. In part, this is meant to improve scientific transparency, so findings can be checked and verified, but it also serves to provide a basis for future studies.
Qualitative researchers have been much slower to adopt data and analysis sharing, for a few different reasons, including both technical and normative constraints. On the technical side, qualitative data has had limited standards, and analysis has often been conducted manually or with specialized software with limited compatibility with other software. More importantly, however, qualitative researchers tend to emphasize the role of both the context of data collection and the perspective of the researcher in the research process - in contrast to quantitative methods that often seek precisely to minimize the subjectivity of their methods and draw wide-ranging conclusions about entire populations.
Moreover, qualitative data often presents challenges for protecting privacy when sharing data, because interviews, focus groups, and other qualitative methods provide rich detail that can make it easier to identify participants even if direct identifiers are removed, as well as often dealing with sensitive issues.
Despite these challenges, however, there is a small but growing movement to share and reuse qualitative and mixed methods data and analysis, helped along by recent technical developments.
In this lesson, we will start by exploring what advantages sharing and reusing qualitative research can offer that might offset the challenges it presents, then practice finding, reusing, and sharing data and analysis projects with the largest qualitative data archive, QDR, and the most widely used coding and qualitative data analysis software, NVivo.
The data we will work with are real data, although the scenario we use is somewhat artificial. Our goal is twofold - to help build literacy and skills for working with secondary qualitative data using relevant tools and to help develop an imagination for how you might reuse and share qualitative and mixed methods data to improve your own research.
Reusing Qualitative Data
The first step to reuse is to understand what elements might be reused and why. Historically, research products like articles and books have been the primary shared output of qualitative research. However, there are at least four other common research products that may be valuable for reuse or adaptation:
- methodologies and instruments
- raw data
- codebooks
- analysis
In the next step, we’ll download some real qualitative data and explore how each of these products might be useful to another researcher.
Types of data
Throughout this lesson, we’ll be using semi-structured interviews, one of the most common types of qualitative data, in our examples and discussion. Content analysis generally involves similar concerns and processes, but uses other kinds of secondary data, such as published print or audio-visual materials. Other qualitative methods, such as participant observation and focus groups, may be somewhat less suited to these tools and approaches and may require adaptation beyond what is discussed here.
Part of the power of qualitative research is its recognition that no method can be truly universal and that all analysis is contextual. We encourage you to treat the discussion and tools here as starting points, rather than templates.
Finding and Downloading QDR Data
Discussing data reuse in the abstract can only get you so far. Instead, we will imagine we face the following scenario and working together to discover how we can take advantage of others hard work to improve our research:
You are preparing to conduct a study of social media users in multiple countries, with a focus on understanding how people make decisions about the privacy of their posts and profiles.
Participants will complete brief surveys about their demographic background, participate in one or more semi-structured interviews, and provide access to their posts on each platform they regularly use for a period of 1 month. You are the lead researcher, but are joined by both long-term collaborators and student research assistants, who are likely to come and go throughout the expected duration of the research.
Your training in qualitative research makes you skeptical of the value of data that was collected for other purposes, but you also know you won’t have much time to collect the data and need to ensure you make the most of the opportunity and structure your interviews so they can reveal critical findings.
One of your collaborators referenced a dissertation that used qualitative methods to study data sharing in qualitative and big social research, and you noticed that the dissertation mentioned that anonymized data are available online. Although your research questions differ from theirs, you wonder if their interviews might help guide how you approach your study and decide to take a look.
The first step to finding out whether this data can help is to get the data.
Following the link in the dissertation, visit the data’s summary page at the Qualitative Data Repository, or QDR. QDR describes itself as
…a dedicated archive for storing and sharing digital data (and accompanying documentation) generated or collected through qualitative and multi-method research in the social sciences and related disciplines.
Essentially, QDR is a place for researchers to share qualitative and mixed methods data in a variety of forms, as well as their analysis projects. Some data are restricted and require an application or agreement before using, but other data, including what we are interested in, are openly available to any registered user.
Before going to the trouble of registering, let’s take a look at what is actually available in this data collection.
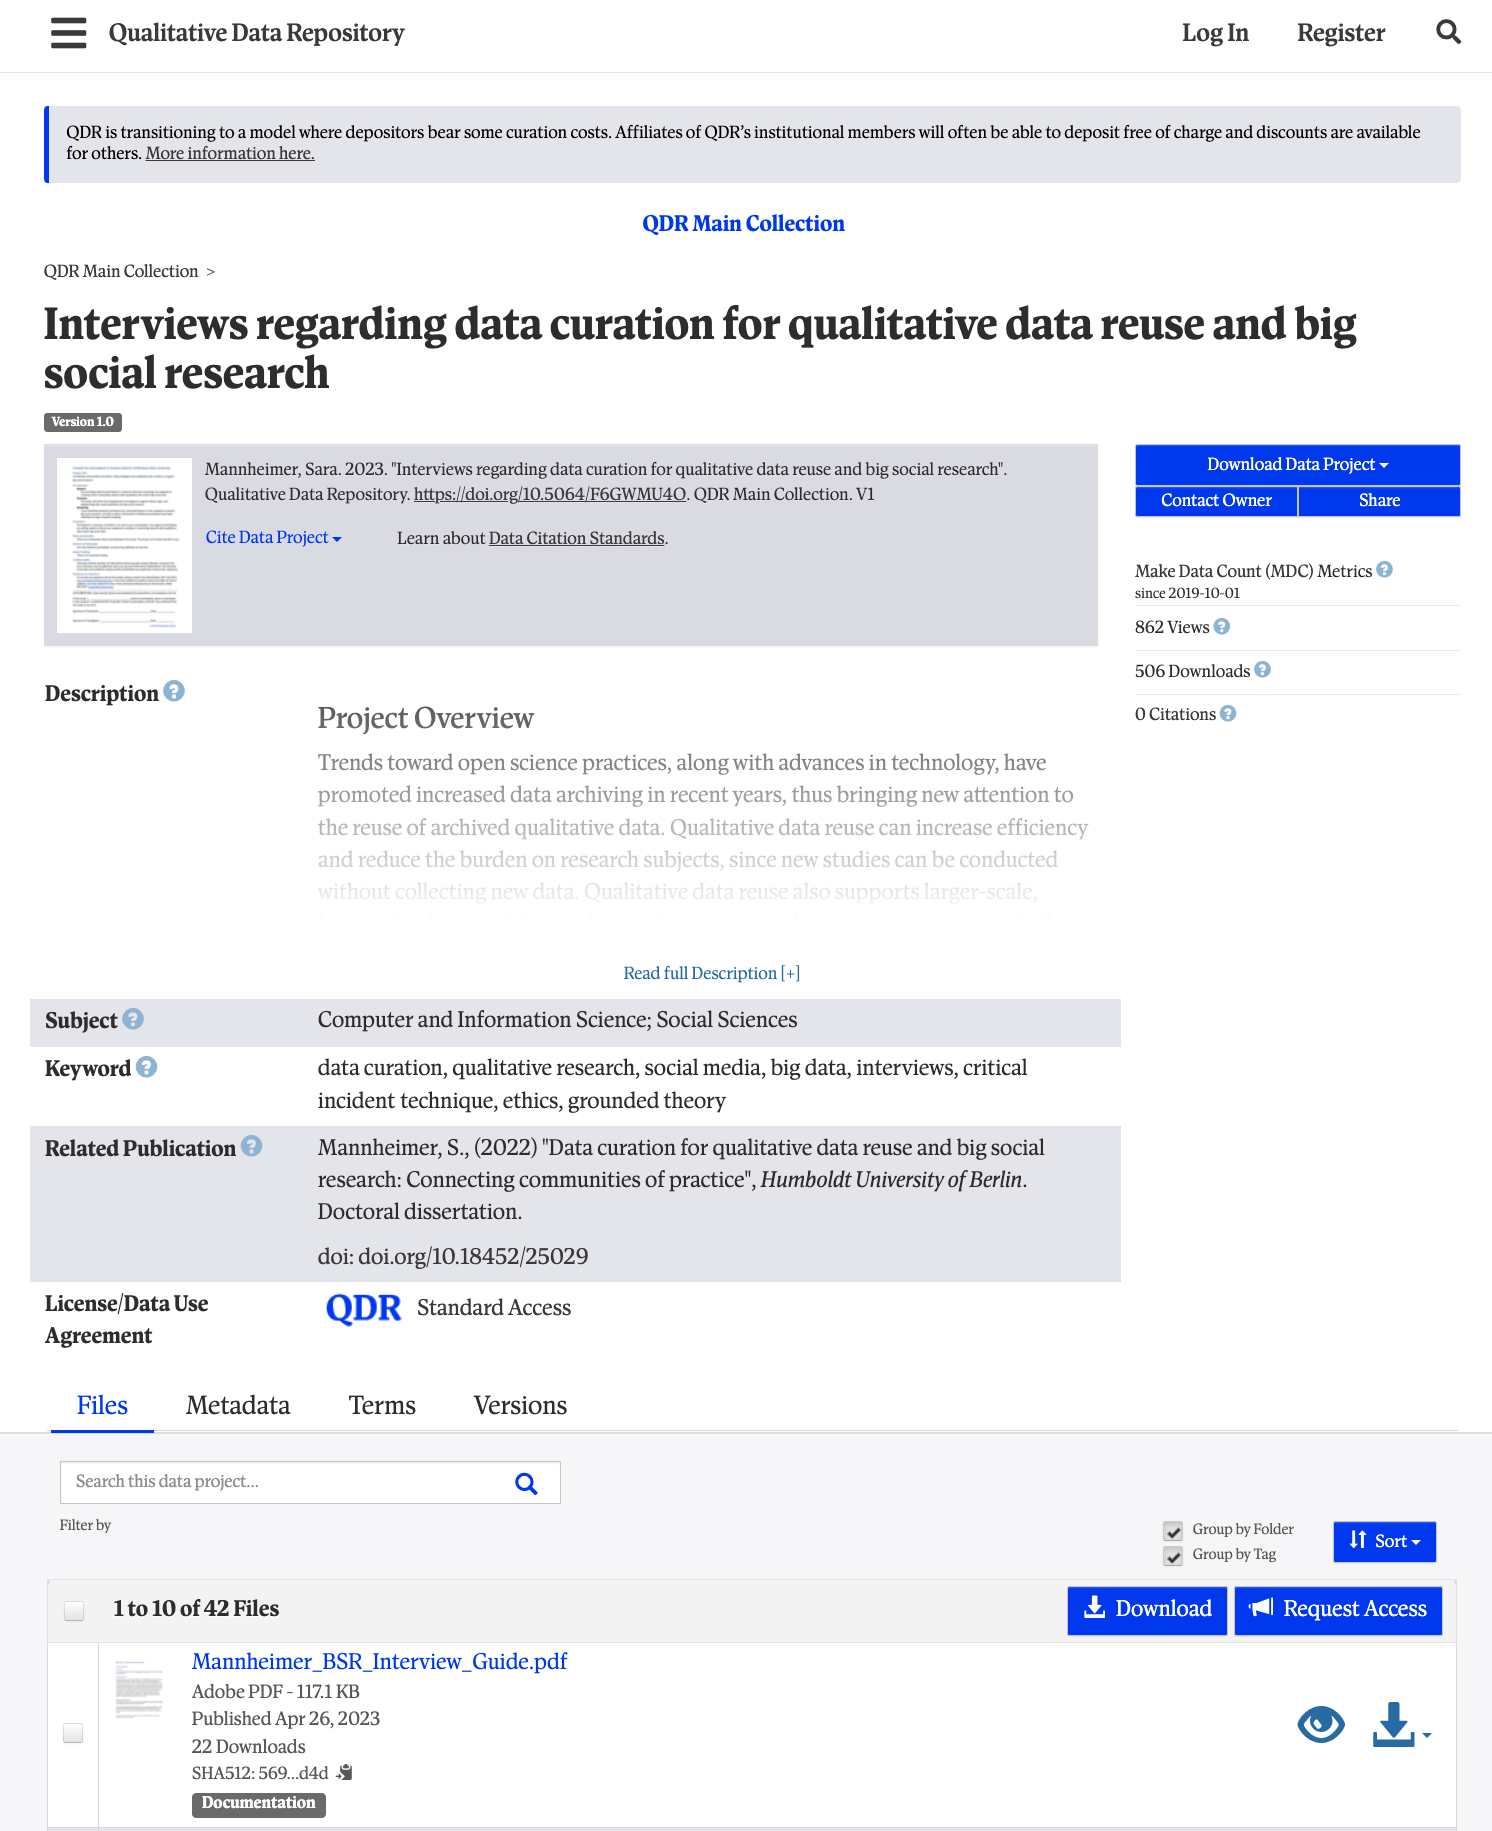
The description, once expanded with the
Read full description button summarizes the project,
research questions, data collection process, and what is included in the
collection here.
Assessing usefulness
Spend a few minutes reading the description and discuss with a partner how helpful you think this data might be for the social media privacy project and why.
This project contains a wide variety of information, including:
- interview transcripts from three different populations
- interview analysis
- participant summaries
- interview guides
- study documents (consent forms, solicitations, IRB)
Both the topic and the range of data available seem promising, and the QDR Standard Access license agreement allows any registered user to download the data, so let’s download it and see what we find!
If you don’t already have one, you’ll need to create an account at
QDR for the next step. To do so, click Register. in the top right
of the summary page. Fill out the registration form and click
Create new account, performing any necessary verification
before proceeding.
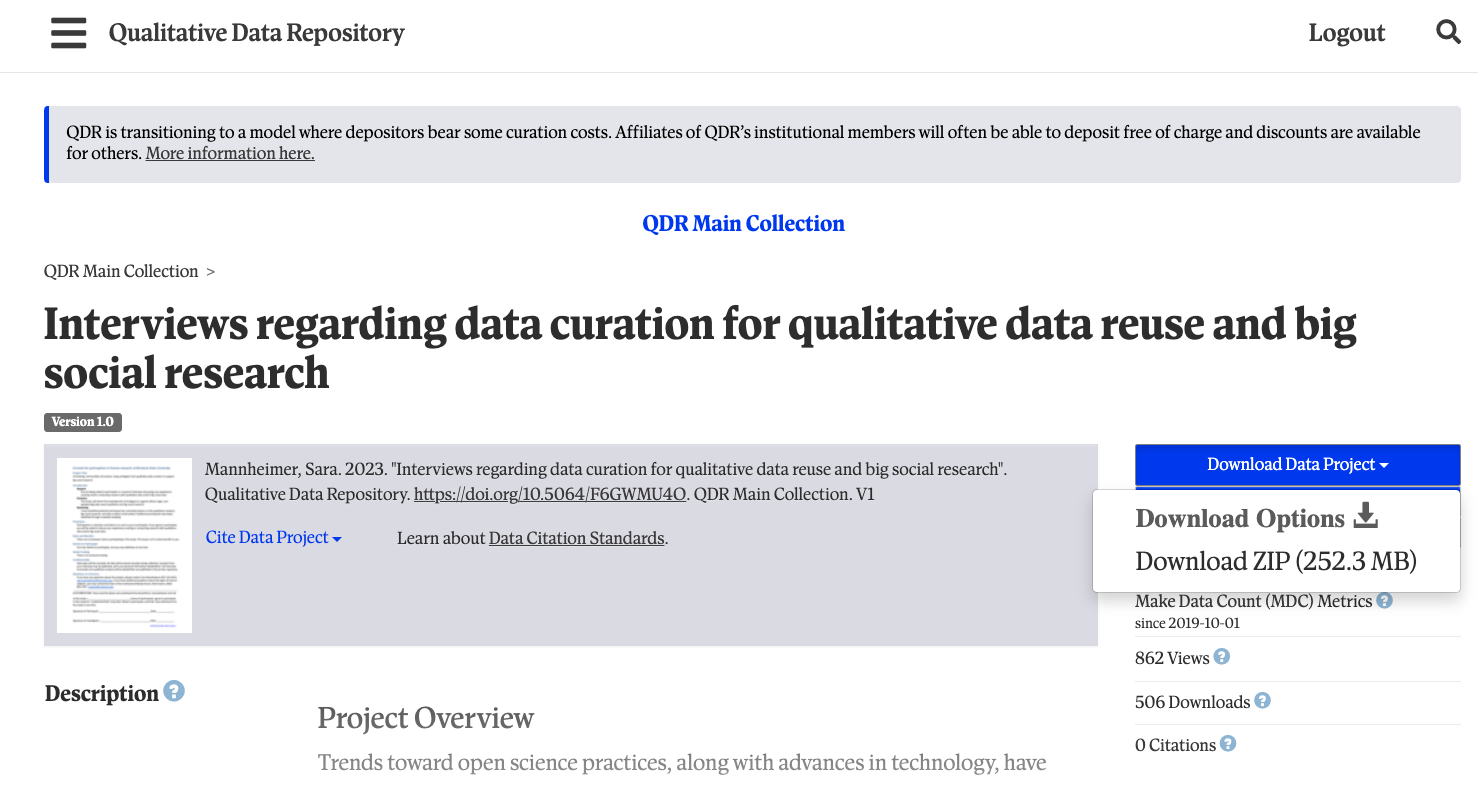
Once you have a QDR account, log in with the button on the top right
and return to the [summary page][mannheimer-qdr]. Click
Download Data Project (see image below), download the ZIP
file to your desktop, and extract the files into a folder on your
desktop.
File types
Open the folder using Finder (Mac) or
Explorer (Windows) and inspect the file extensions
(the part after the . in the filename). What types of files
are included and what software would typically be used to open them?
Don’t worry if you don’t recognize all of the file types. Just
identify what you know. If you have time during the exercise, you can
use a web search like open pdf file) to search for
information.
The project includes the following four types of files:
-
txtfiles are plain text and can be opened in any notepad or document software -
pdffiles can be opened withAdobe Readeror other document software -
nvpxfiles are NVivo for Mac projects and can only be opened in NVivo for Mac or converted in NVivo for Windows to a Windows format -
qdpxfiles are the REFI-QDA qualitative interchange format and can be opened in a variety of qualitative software
In this project, the txt files provide
metadata, or information about the project, while all other
files are part of the data itself. Taguette can’t read nvpx
or qdpx files, so the most important files to us will be
the pdf interview transcripts.
Methodologies and Instruments
Maybe you noticed something interesting about the interview topics in
the description when we first looked at the data on QDR. Let’s look
again, either on the project
page or by opening the README_Mannheimer.txt in a text
editor.
In collections of data or other multi-file downloads, there is often
a file named readme.txt or something similar. These are
meant to provide an overview of the collection and how to go about using
them.
Let’s zero in on the first paragraph under
Data Description and Collection Overview:
The data in this study was collected using semi-structured interviews that centered around specific incidents of qualitative data archiving or reuse, big social research, or data curation. The participants for the interviews were therefore drawn from three categories: researchers who have used big social data, qualitative researchers who have published or reused qualitative data, and data curators who have worked with one or both types of data. Six key issues were identified in a literature review, and were then used to structure three interview guides for the semi-structured interviews. The six issues are context, data quality and trustworthiness, data comparability, informed consent, privacy and confidentiality, and intellectual property and data ownership.
This short paragraph packs a great deal of information about the interview topics and questions. Our topic of social media privacy may share a good deal with some of the issues the original interviews focused on. Let’s look a little deeper into what we can learn to help in our own study.
Reviewing study materials
Study materials from previous studies, like interview schedules or participant observation memos, provide a window into what might work for other related studies, including both what to ask and how to approach asking. Moreover, if the research dealt with a similar study population and the final product addressed topics of interest in your study as well, it also provides some evidence that a similar study design can be effective not just in theory but in practice.
Use the information in README_Mannheimer.txt to locate
the 3 interview guides and use the readme and guides to answer the
following questions:
- Which of the six issues the researchers identified seem most relevant to planning your study? Why?
- Is one of the original study populations more relevant to understanding shared issues with your study? Which one and why?
- Read through the questions in the interview guide for the most relevant population you identified above. Are there questions that might be adapted or borrowed for your own interviews about social media privacy decisions?
The activity above is most effective when participants are able to debrief for about 5 minutes either with small groups of 3-5 learners or as a larger group. When used independently, the learner may want to write down some notes instead.
Alternatively, this activity may be moved to after the Taguette project is created, in which case learners can import the files into their project and annotate them using linked memos.
For now, we’re going to focus on the Big Social Research group, because the type of data they were interviewed about their work with is the most similar to what our participants may be sharing. You may have drawn a different conclusion, and likewise, each group might provide unique insights.
If we can adapt questions and anticipate concerns and challenges relevant to our data collection, we may be able to improve the quality of our study and interview design, without repeating all the background research from the previous study.
Raw Data
Interview schedules and study plans provide insight into the research team’s expectations and approaches. The power of raw data, such as interview transcripts, is that it shows (much more directly) how the study participants construct their own views of the study topics and respond to the questions. Context and constructivism are core concerns of most qualitative researchers, leading the raw data to be possibly the most critical aspect of data for faithful and effective reuse.
That said, while it’s possible to conduct entirely secondary studies if enough raw data are available in relevant context that address relevant topics, those conditions are rarely met. Rather, raw data tends to serve as a type of pilot study - providing initial evidence as to where to begin and what to ask while still allowing the new research team to explore aspects of the data that were less relevant or highlighted in the original study.
One of the most commonly-analyzed types of raw qualitative data is interview transcripts, like we have in our project. Some tools provides support for working directly with audio and video files, but Taguette only supports text documents. Text, however, is often preferred because it simplifies the process of removing potentially identifying information and enables rapid scanning of content and accessibility technology.
Let’s open one of the Big Social transcripts,
Mannheimer_BSR01_Transcript.pdf, in your default
pdf reader and look at how transcripts are structured in
this project.
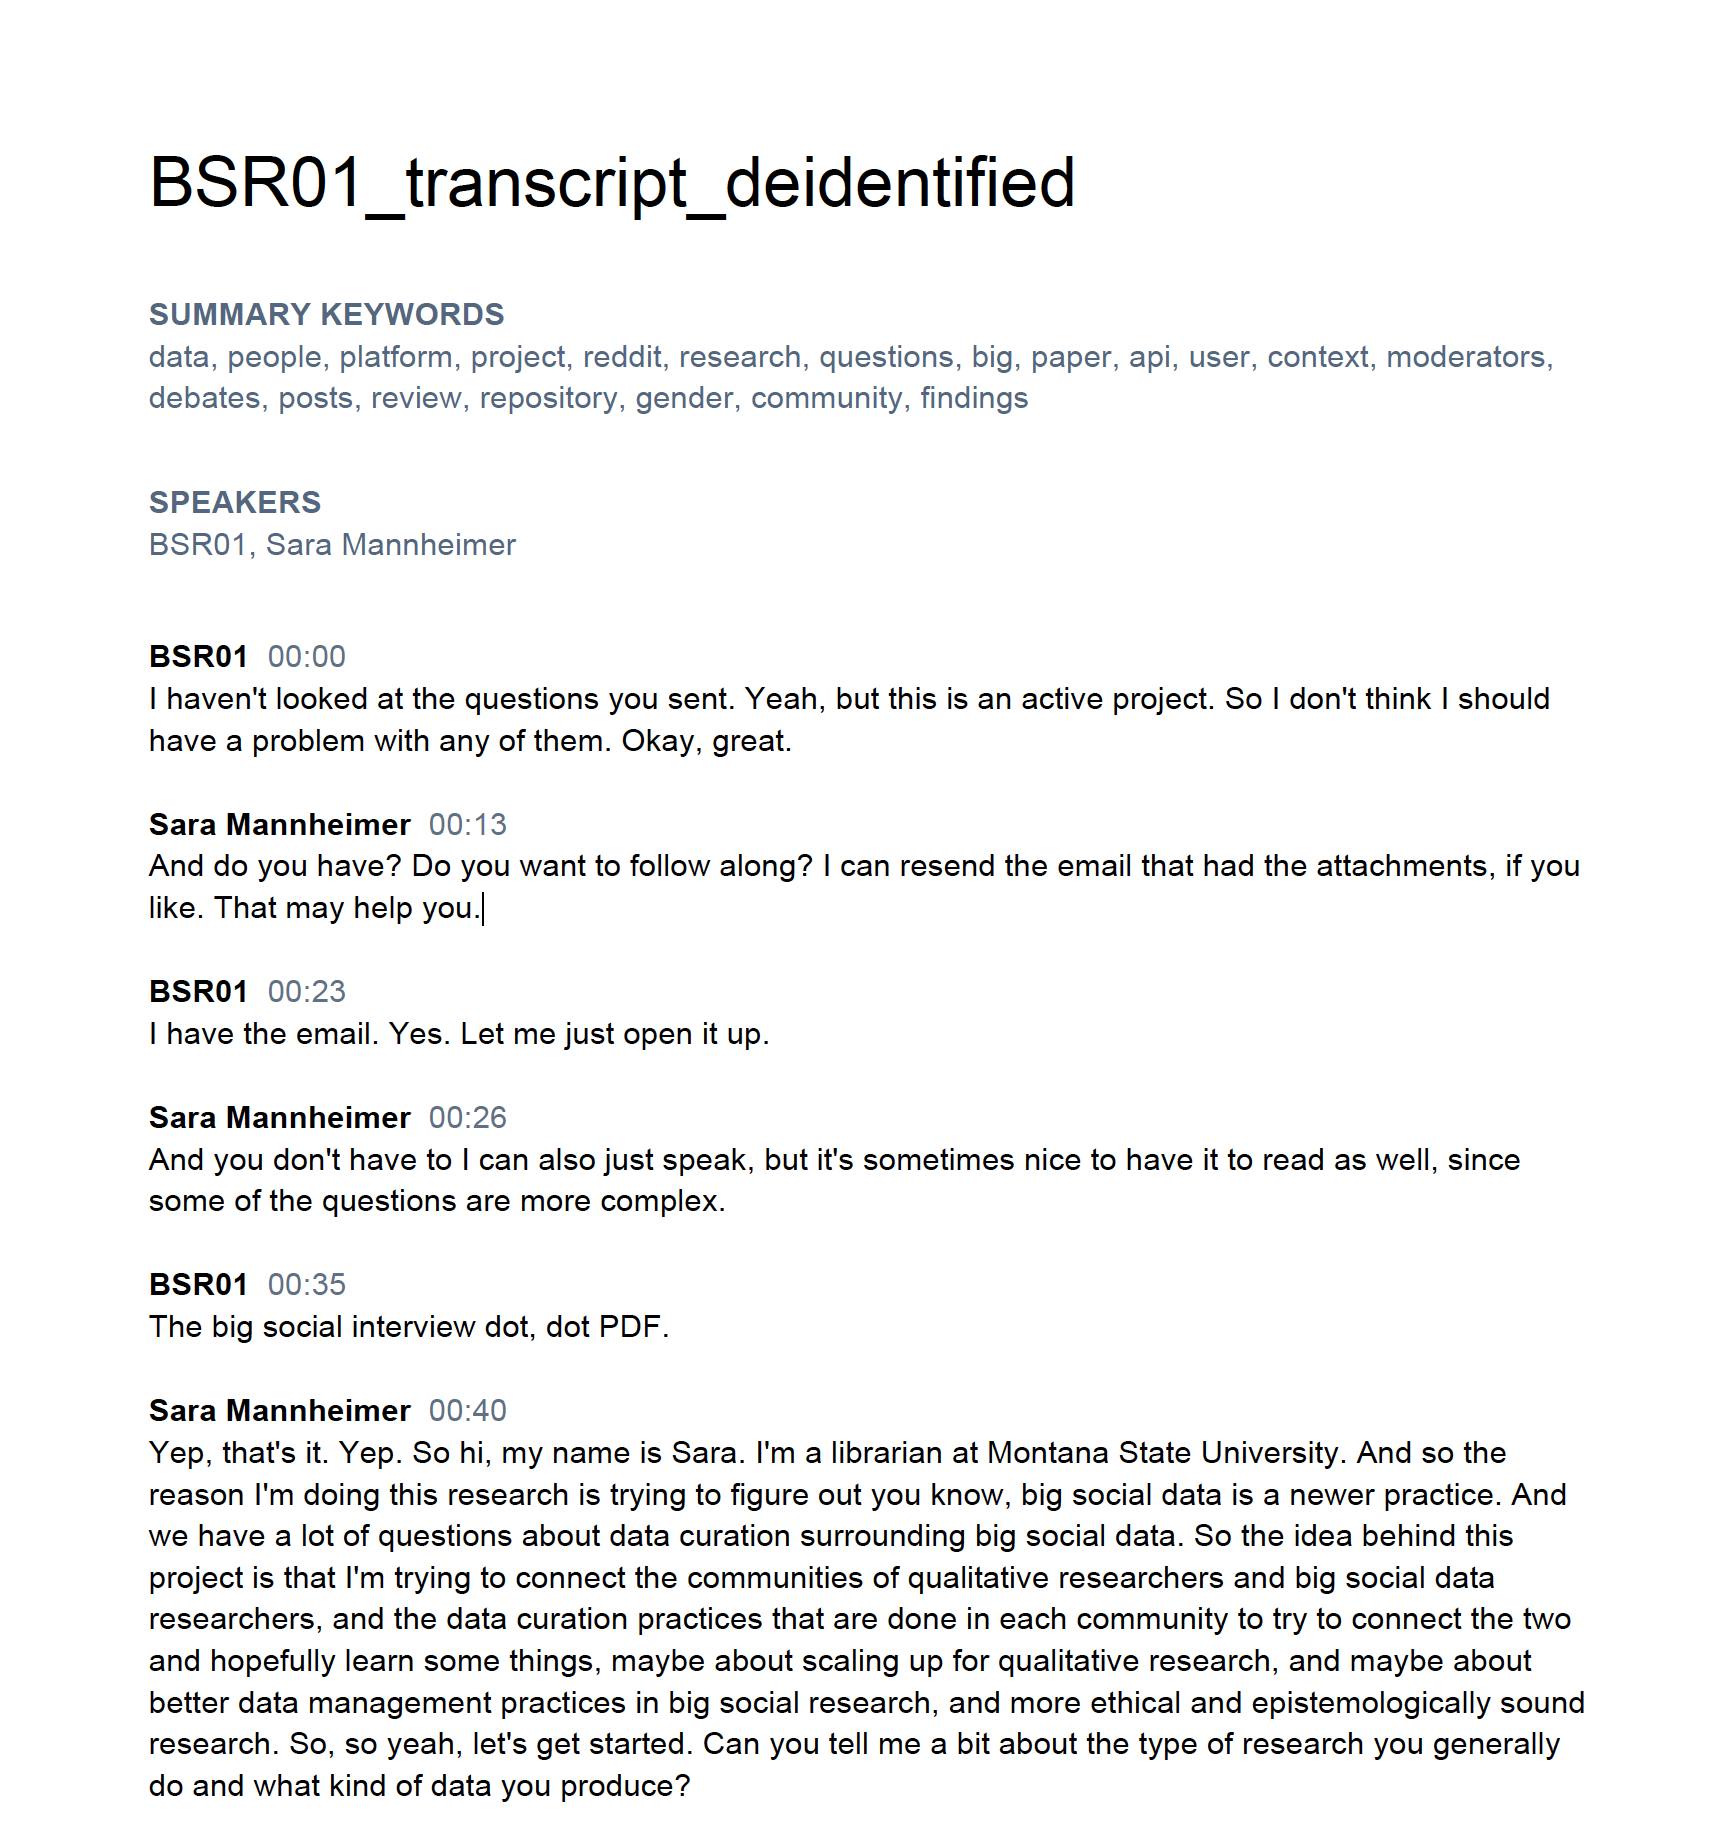
PDF files appear as page images, but most modern PDFs
allow you to select text and other elements. In this transcript, we see
a few header elements:
- The document title
- A set of summary keywords identified by the original investigators as relevant to this interview
- A list of all speakers
After the speaker list, the transcript itself begins with each paragraph denoting a switch in speaker. The speaker’s identifier and a time stamp for the start of the conversation comprise the first line, followed by the transcribed text.
Reading even this first section in the image, we can get some insight
into decisions the research team made and how they worked. From
BSR01’s very first sentence, we see the researchers sent a
list of interview questions in advance but with mixed results:
I haven’t looked at the questions you sent. Yeah, but this is an active project. So I don’t think I should have a problem with any of them.
The respondent may not have read all the questions but did identify a project that the rest of the interview will revolve around.
Critical incident technique
Framing a qualitative interview around one specific event or project is a technique known as a Critical Incident Interview and often elicits a wider variety of reflection than abstract questions alone.
Reading interviews
Read the following excerpt from BSR01s interview and
consider the questions below:
Sara Mannheimer
All right on to privacy and confidentiality. Can you tell me about a time if any during your research process when you considered issues of privacy, protecting the data during your research or protecting the people on the platform.
BSR01 25:03
Yeah, so a good example of that would be my previous project where I was looking at biases in the language of peer review. I was looking at gender bias, what are the biases looking with gender bias. For that we had an external annotator annotate gender for the authors on the platform of these papers. And the protocol we followed was semi automatic. So we use the US Social Security data to infer genders with some confidence probability. For example, if there was a certain name, let’s say Jack, that was reported as male 99% of the time, we would tag it as male. And same thing if it was reported as female and 99% time we would tag it as female or non male rather. But if it was less confident, we had the human annotator, search for the name search for their Google profile and make a guess as to what this person’s gender is. So we were, so we were trying to mimic the reviewers perception of the author’s agenda. And because bias, the bias would be driven based on that perception, and not the self reported gender of the author. We did not release these gender annotations, because we didn’t, we thought it would cause issues if we mislabeled an author’s gender. And these authors are a part of the community that we publish. Yeah. So we opted to not release identities. And we actually at the end of the paper, we actually have an ethics statement where we talk about why we’re not doing that. But the data, the data itself is public.
Sara Mannheimer 27:08
And I guess sometimes with social media, there are like considerations of move it, like moving the data out, out of its context, in Reddit, you know, and you’re letting it be downloaded. I think in your situation, since all of the users were anonymous, that changes things a little.
BSR01 27:33
So they were anonymous in the sense that I couldn’t tie it to their real identity. But some people use this same username on all these online platforms. And that is that that is a concern. So let’s say there’s a user in my data who said something they regret, and they delete their post or their comment. It’s still going to be there in my data set.
Your study, again, is focused on the decisions individual social media users make about the privacy of their posts. This excerpt is primarily focused on how researchers protect (or fail to protect) the privacy of online users.
- What direct discussion, if any, is there of user privacy decision processes here?
- How might the example of name matching processes used by
BRS01inform how your team asks about privacy concerns with your study participants?
The activity above is most effective when participants are able to debrief for about 3 minutes either with small groups of 2-3 learners or as a larger group. When used independently, the learner may want to write down some notes instead.
Alternatively, this activity may be moved to after the Taguette project is created, in which case learners can view the transcript directly in their project and use linked memos to annotate any notes relevant to their project.
Key Points
- Qualitative data can take many forms, but text or transcribed audio-visual data are among the most common
- Reusing existing qualitative data can help plan studies more efficiently and effectively
- Qualitative coding and data analysis tools are each compatible with different formats of data
- The Qualitative Data Repository is a source for vetted qualitative and mixed methods data
Content from Setting up a Taguette Project
Last updated on 2024-07-11 | Edit this page
Estimated time: 25 minutes
Overview
Questions
- How are projects organized in Taguette?
- What limitations are there on documents in Taguette?
Objectives
- Create a Taguette project and import documents
- Apply consistent naming conventions to project documents
Once we have a general sense of the data we’ll be using and what format it needs to be in, the next step is generally to create a project in a qualitative software package and import the de-identified raw data.
Qualitative software is sometimes called CAQDAS, an acronym for Coding and Qualitative Data Analysis Software to recognize the two essential functions of qualitative research software:
- Apply codes or tags systematically to a collection of data sources
- Analyze codes (and sometimes raw data or secondary sources) to draw conclusions
CAQDAS have various features that may be useful for particular types of data or methodologies. This lesson includes an alternative software options page for those interested in learning about other CAQDAS.
Taguette is an open-source and cross-platform tool for basic coding and analysis of textual data. It is free and can be installed on your own computer or used online with Taguette cloud.
Starting Taguette
If you haven’t already installed Taguette, please follow the instructions in [Summary and Setup][../index.html] before proceeding.
When you first open Taguette, there may be a short delay and you may see a text window open (you can ignore this for now) then a new tab will open in your default browser that looks something like the image below.
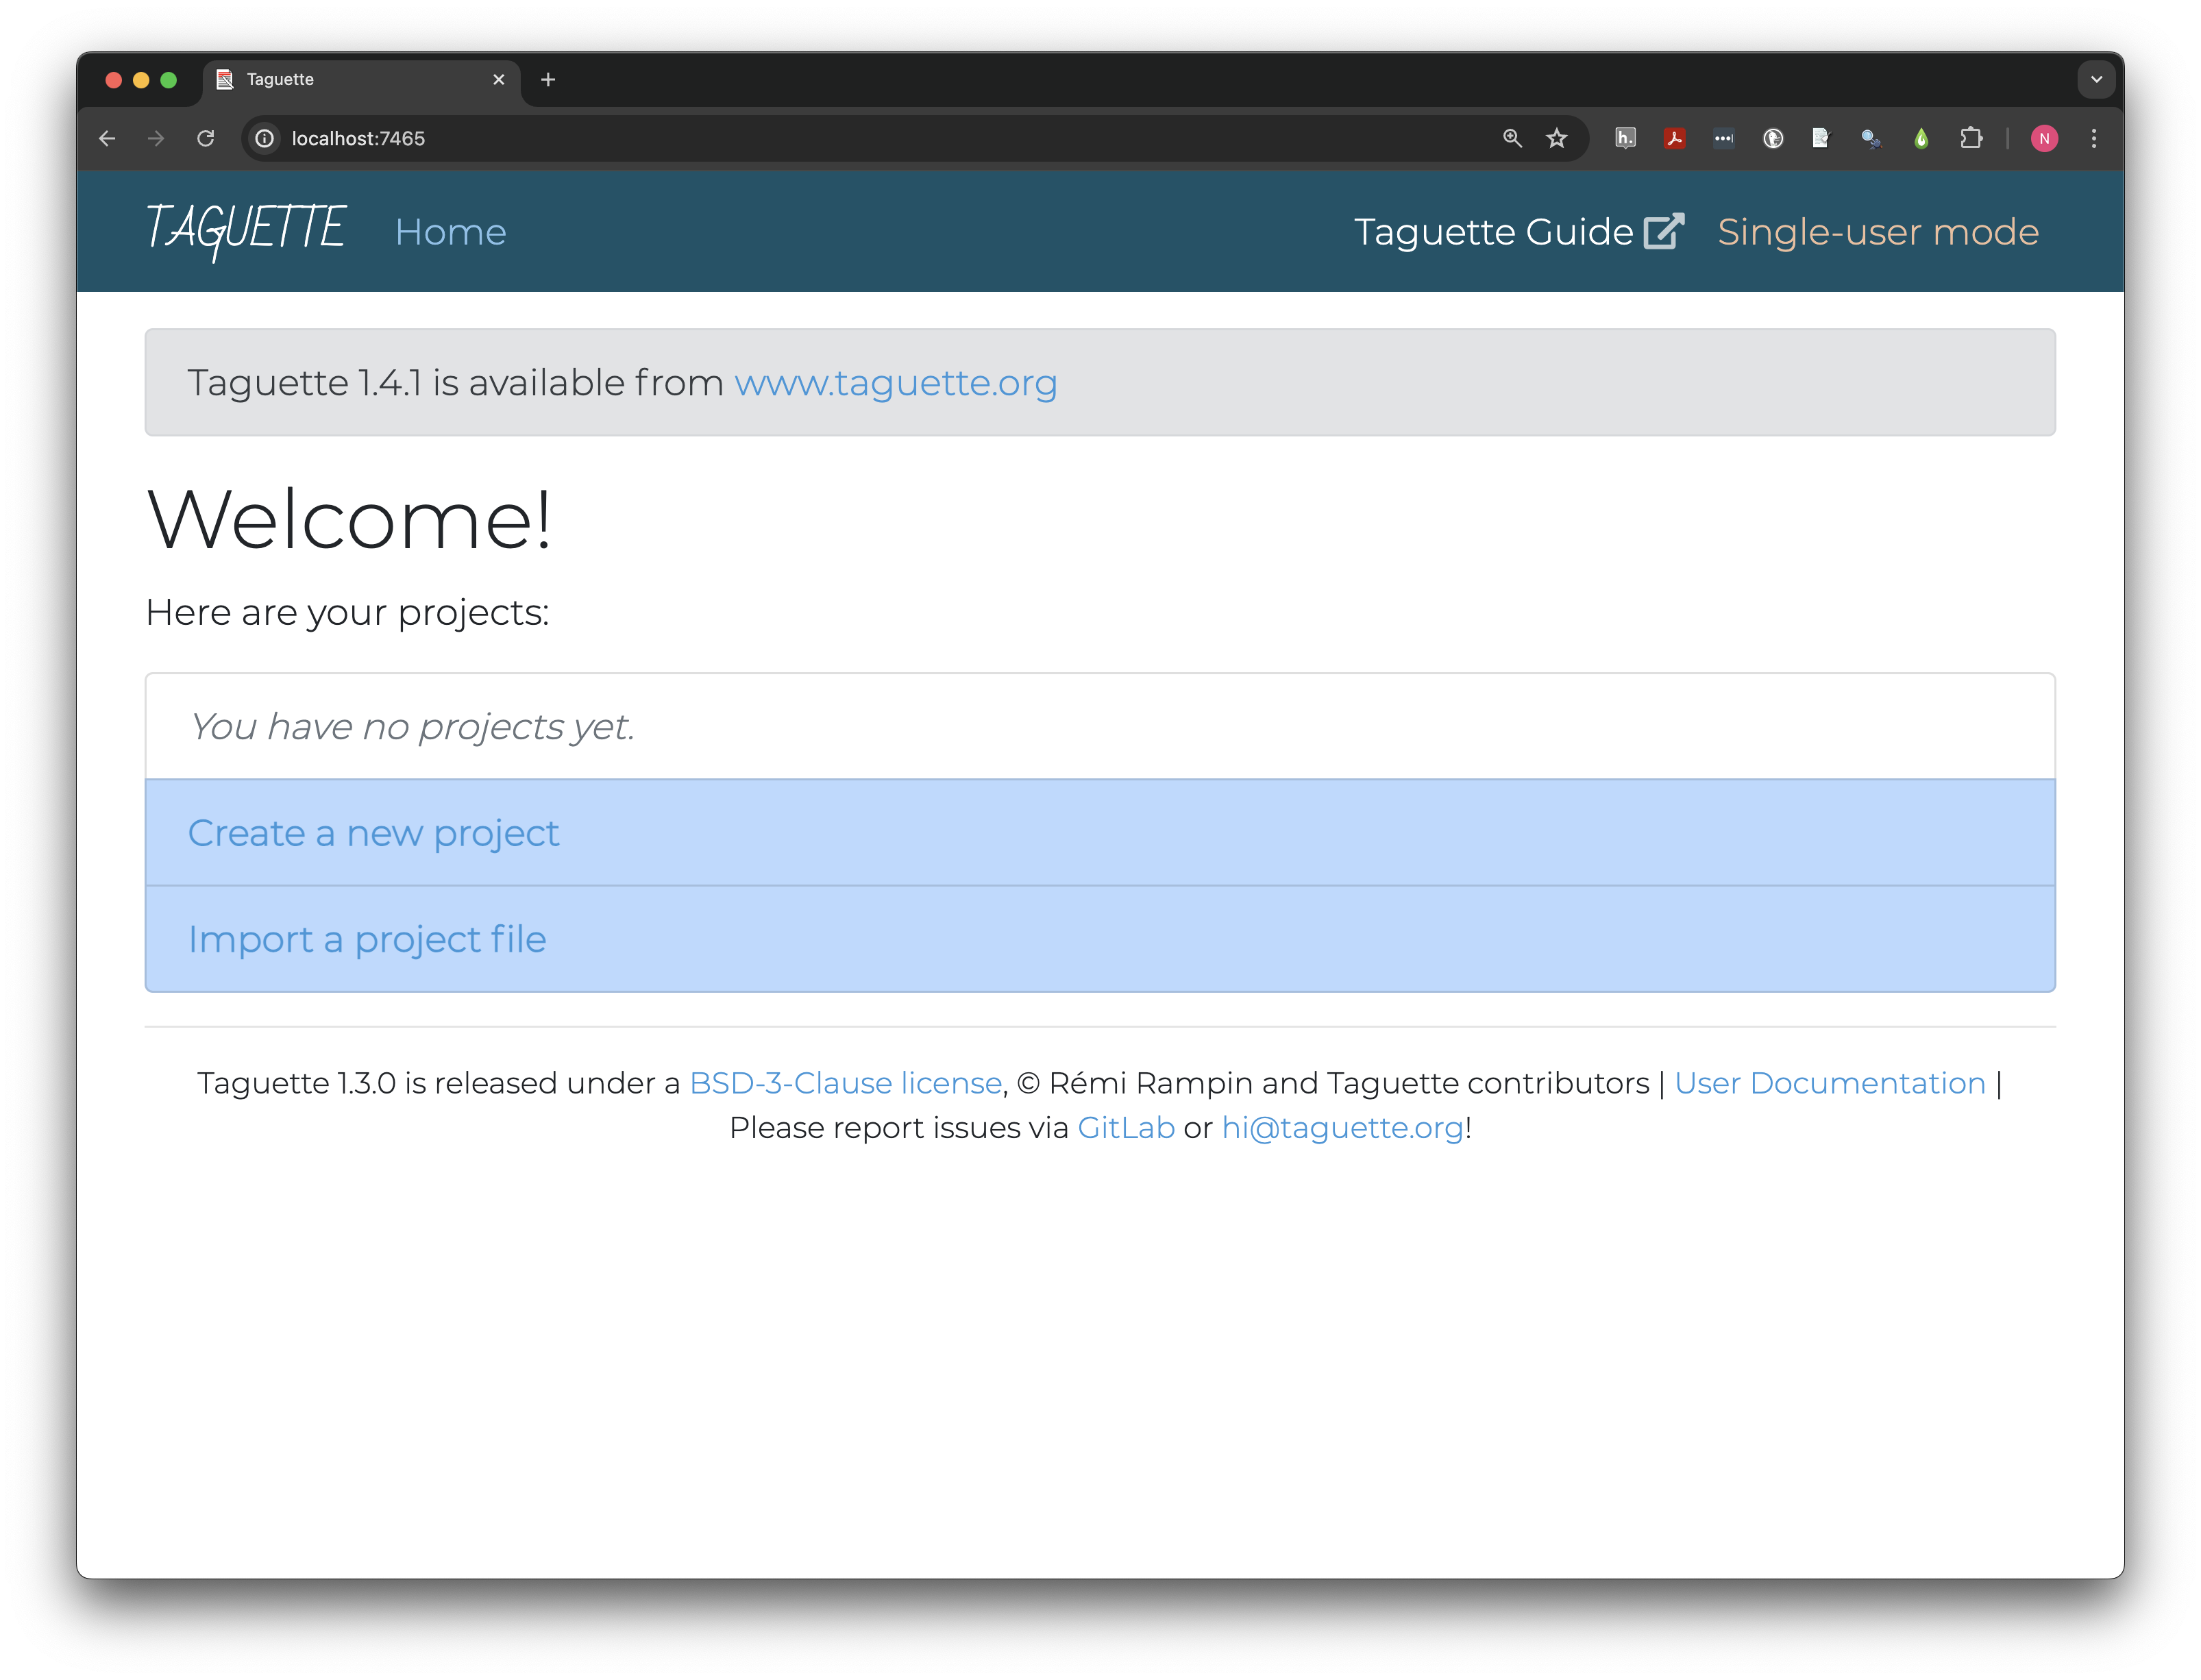
Taguette Cloud users will
need to create an account and login and may also notice some differences
in the launch page. Instead of localhost:#### their address
bar will read app.taguette.org. Additionally, where
Single-user mode is highlighted on the local version, there
will be an Account dropdown menu at the top right and the
welcome will show their username.
Users may also notice banners on one or both versions, and, if they have already created projects, those will appear as a list in the table.
If learners using the local version have questions, instructors may wish to explain that the text window is essentially creating a temporary web application that is run entirely on their computer without sending any data to the internet.
In the future, callouts with persistent tab selection may be used to allow lesson users to automatically see relevant screenshots and discussion for their version of the software. If you would like to contribute to this project, please contact the lesson maintainers.
Creating a project
Work in Taguette is organized in projects, each of which contain
their own sets of documents, tags, and
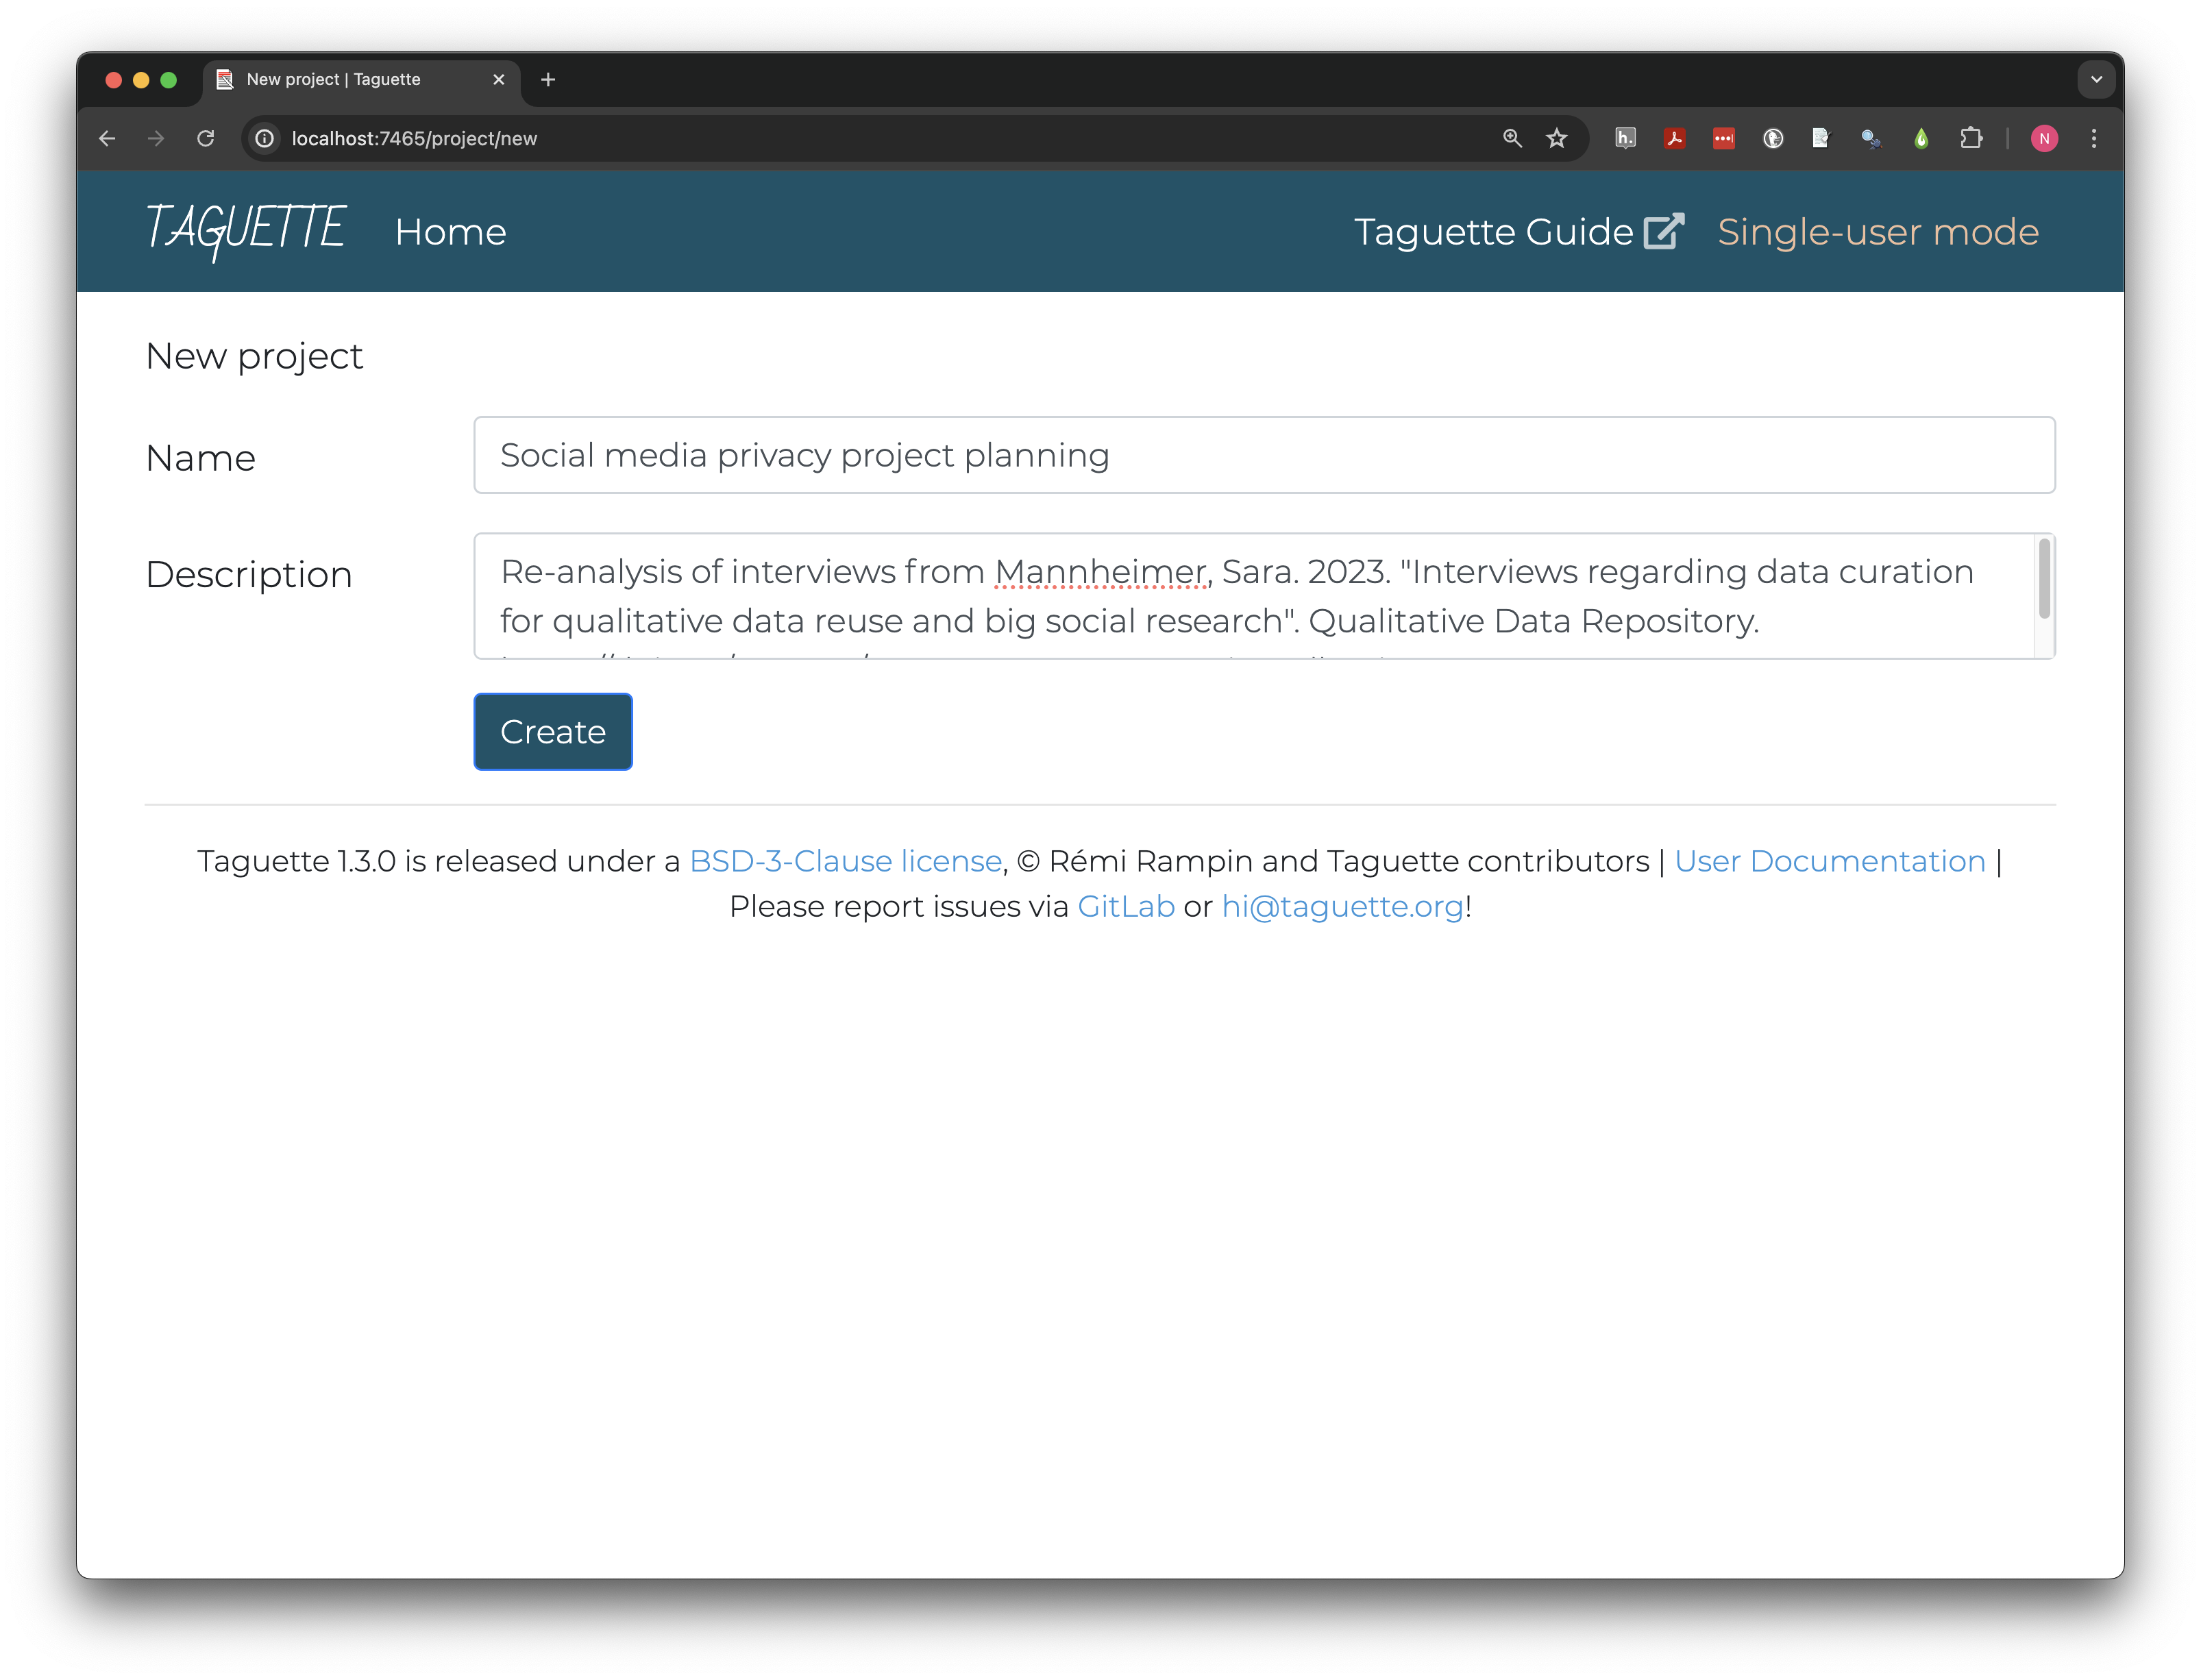
highlights. Click Create a new project and give it
a clear name like Social media privacy project planning.
Descriptions are not required but can be invaluable in finding the right
project and documenting sources. Because we’re re-using archival data,
document the data source in the Description field.
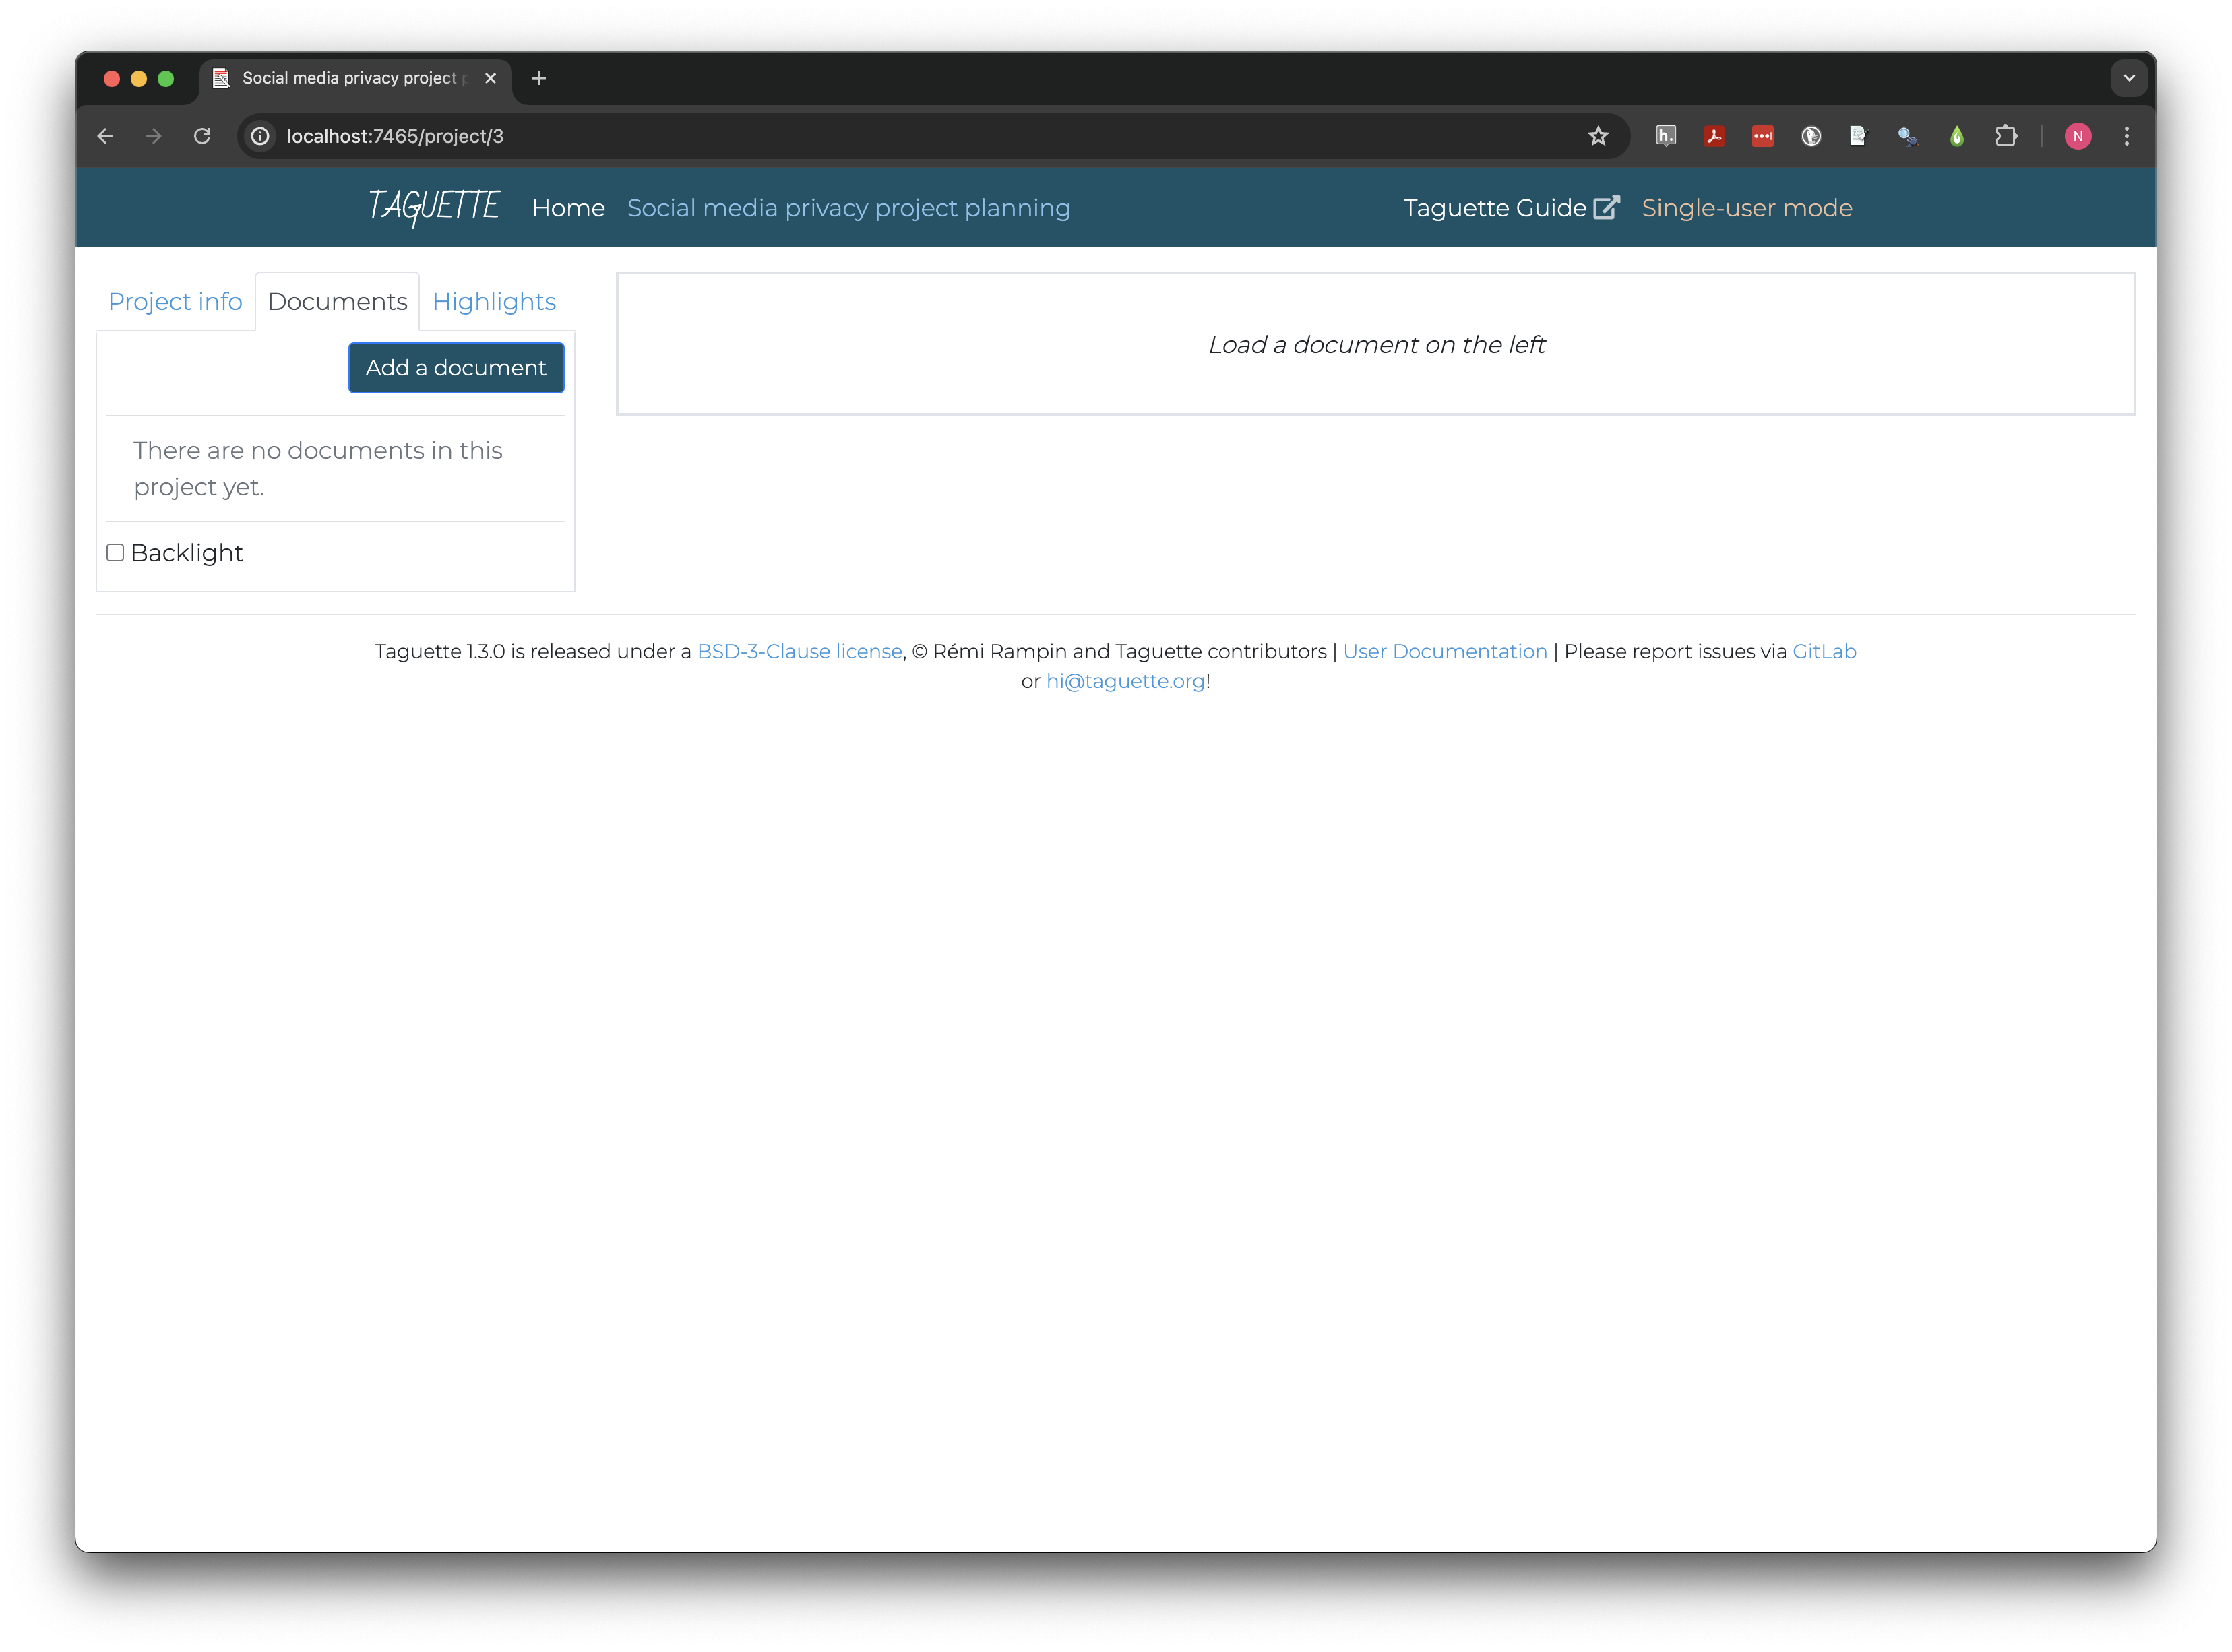
Clicking Create takes us to the project page, where all
our interactions with the project will take place from now on. The left
pane contains tabs to view or edit Project info, import or
navigate Documents, and create or view
Highlights. The right pane will display documents and
highlights.
Importing and navigating documents
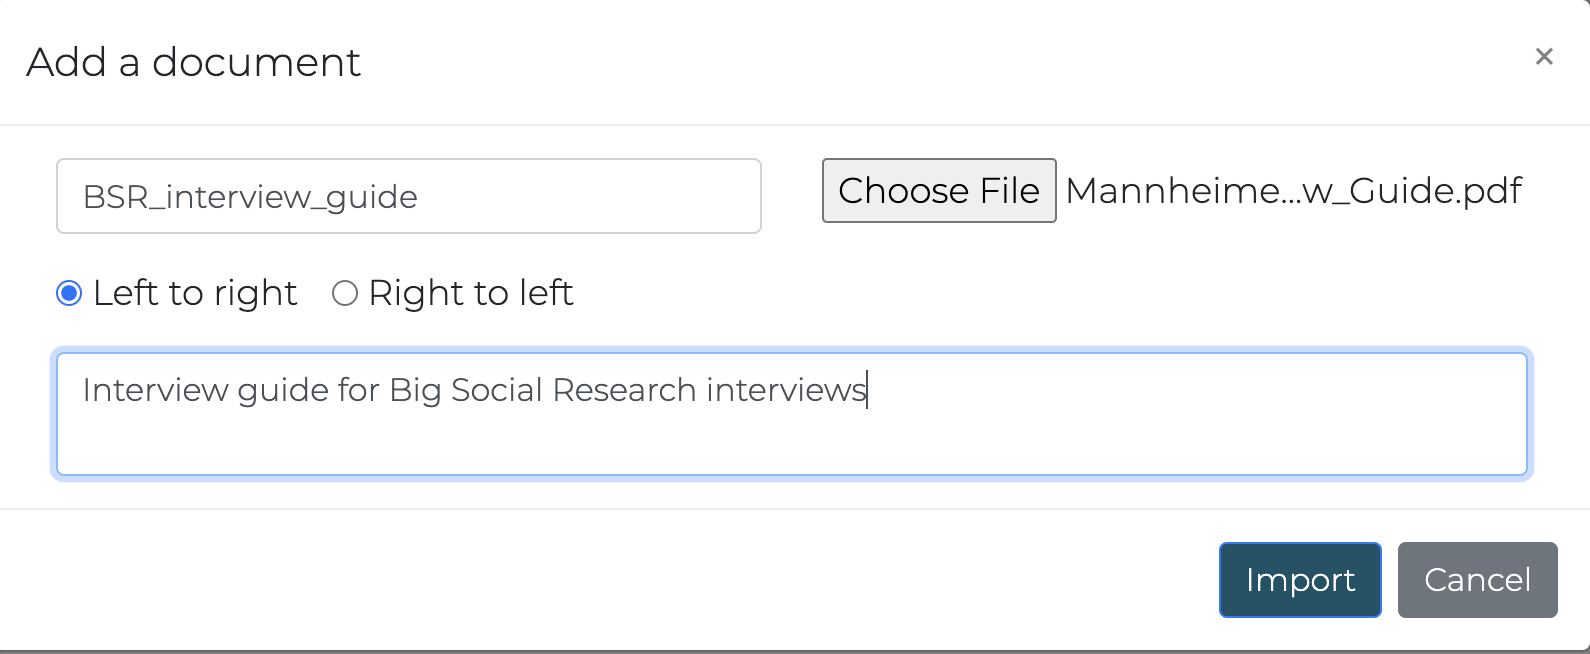
Documents can be imported one at a time with the
Add a document button in the Documents tab of
the left pane. The first document you may want to add is the interview
guide.
Once the document is imported, open it by clicking its title on the left.
Semi-structured interview guides often include both main questions like Did you publish any of the data from your example? and planned follow-up probes meant for when the participant doesn’t volunteer as much information as the interviewer is seeking. For the question above, there are three probes to learn more about data publication (about 2/3 of the way down the document):
- Is the data published in a repository? Which one?
- What are your plans for storing, retaining, and deleting data in the future?
- Who has access to the data?
Format limitations
Taguette can only import a limited number of the most common types of
text documents, including .pdf, .docx,
.txt, .odt, .md, and
.html files. Images and most formatting will also be
stripped when documents are imported.
Scrolling through the interview guide for example, it looks like
outline levels and section headers were flattened and a
Document Outline based on formatting in the original
pdf was added.
Adding more documents
On your own, find and add each of the
Big Social Research interview transcripts from the
Mannheimer project. Make sure to use short, clear, consistently
structured names to make it easy to navigate between documents. Also add
the BSR Interview Guide as a reference, though we won’t add highlights
because it only contains the questions.
This project already uses a sequence of numbers to distinguish
respondents without using names. One simple naming convention is
BSR_##, where number is the respondent number
(i.e. BSR_01). Some interview numbers may be missing; the
readme file states why: “Two participants declined to have their data
shared.”
Documents cannot be created or edited in Taguette. Any changes, including the removal personally identifiable information from data that will be shared, must take place before they are added to the project.
Key Points
- Taguette’s interface has two main sections, a left pane for navigating, and a right pane for viewing
- Documents should be cleaned and anonymized, if needed, before adding to a Taguette project
- Consistent document naming conventions make projects easier to navigate
Content from Best Practices for Qualitative Coding
Last updated on 2024-07-31 | Edit this page
Estimated time: 60 minutes
Overview
Questions
- What is the difference between inductive and deductive coding?
- How can I set up and apply a flexible code tree in Taguette?
- How can I create and view highlights in Taguette?
Objectives
- Distinguish between inductive and deductive approaches to coding
- Develop deductive codes relevant to project objectives
- Create and view highlights in Taguette
Beginning qualitative researchers often want to jump right into analyzing their data once documents are added to their project, but taking the time to develop a coding protocol first can save time while improving the transparency and quality of research.
The first step is typically to choose a coding philosophy, that is, to decide how and why code labels will be chosen and applied. Coding philosophies range along a spectrum from inductive to deductive approaches.
Deductive and Inductive Reasoning
Deductive reasoning begins from assumptions and hypotheses. It seeks to determine, using logic or data, whether the hypotheses can be shown to be false (or true).
Experimental methods in many disciples follow this pattern. First, a hypothesis or prediction about the effect of some cause is developed based on past research and observation. An experiment is conducted to isolate that specific potential cause, and conclusions are drawn based on the presence (or lack) of difference made by the difference.
A medicine trial is a classic example of a deductive approach. Scientists predict that a medicine will help people in a specific way (for example, by reducing the length of an infection). They recruit participants (patients with the infection) who are randomly assigned so that some receive the medicine and others receive a placebo with no medicine. If the length of the infection is statistically shorter in the patients who received the medicine, that is taken as evidence that the medicine likely produced the desired result.
Deductive reasoning relies on minimizing exposure to outside variables that might affect the outcome of interest, or otherwise statistically adjusting for potential confounding factors.
Inductive reasoning, by contrast, seeks to draw more naturalistic conclusions by making close observations while recognizing personal biases and limits to observation. Inductive qualitative research draws on patterns observed in data to make predictions, generalizations, or analogies about more general patterns. Put differently, deductive research is explanatory in nature, while inductive research is exploratory.
Inductive social research often draws on critical or constructivist perspectives that emphasize how individuals and groups describe their own experience.
Taken in a longer scope, science can only develop through the complementary use of induction and deduction, sometimes visualized as a circular cycle. Observation is used to develop hypotheses, which are tested deductively through more observation. If hypotheses are not fully confirmed, inductive reasoning is used to develop revised or alternative hypotheses.
[FIGURE OF SCIENTIFIC PROCESS]
Even though deductive and inductive reasoning are both part of nearly every study in some way, how qualitative data is coded depends on the general purpose of the study. Exploratory studies tend to adopt an inductive method, while explanatory studies use more deductive approaches to code development.
Inductive coding
In 1967, US sociologists Glaser and Strauss formalized (grounded theory)[https://en.wikipedia.org/wiki/Grounded_theory], one method for conducting structured qualitative research without presupposing a hypothesis or theory. They recognized that how people experience the world (i.e., the economy) can be at least as important as traditional measures (i.e., personal income or gross domestic product).
In grounded theory and other inductive coding methods, qualitative data like interview transcripts are read carefully and initial codes are applied that match the language and interpretation proposed by study participants themselves as closely as possible.
Often, researchers label codes in this open coding phase by using their judgment and experience to discern underlying themes in the experiences expressed across interviews.
In our scenario, the goal of this analysis is to prepare for
collecting and analyzing new data related to social media privacy and
confidentiality. BSR_05 is with a PhD student studying
political communication.
We can open BSR_05 in Taguette from the
Documents tab. The text of the interview should appear on
the right. In the body of the interview, speaker names and the time they
started speaking in the recording appear on one line, followed by what
they said. Sara Mannheimer is the interviewer and
BSR05 replaces the name of the student for privacy
protection.
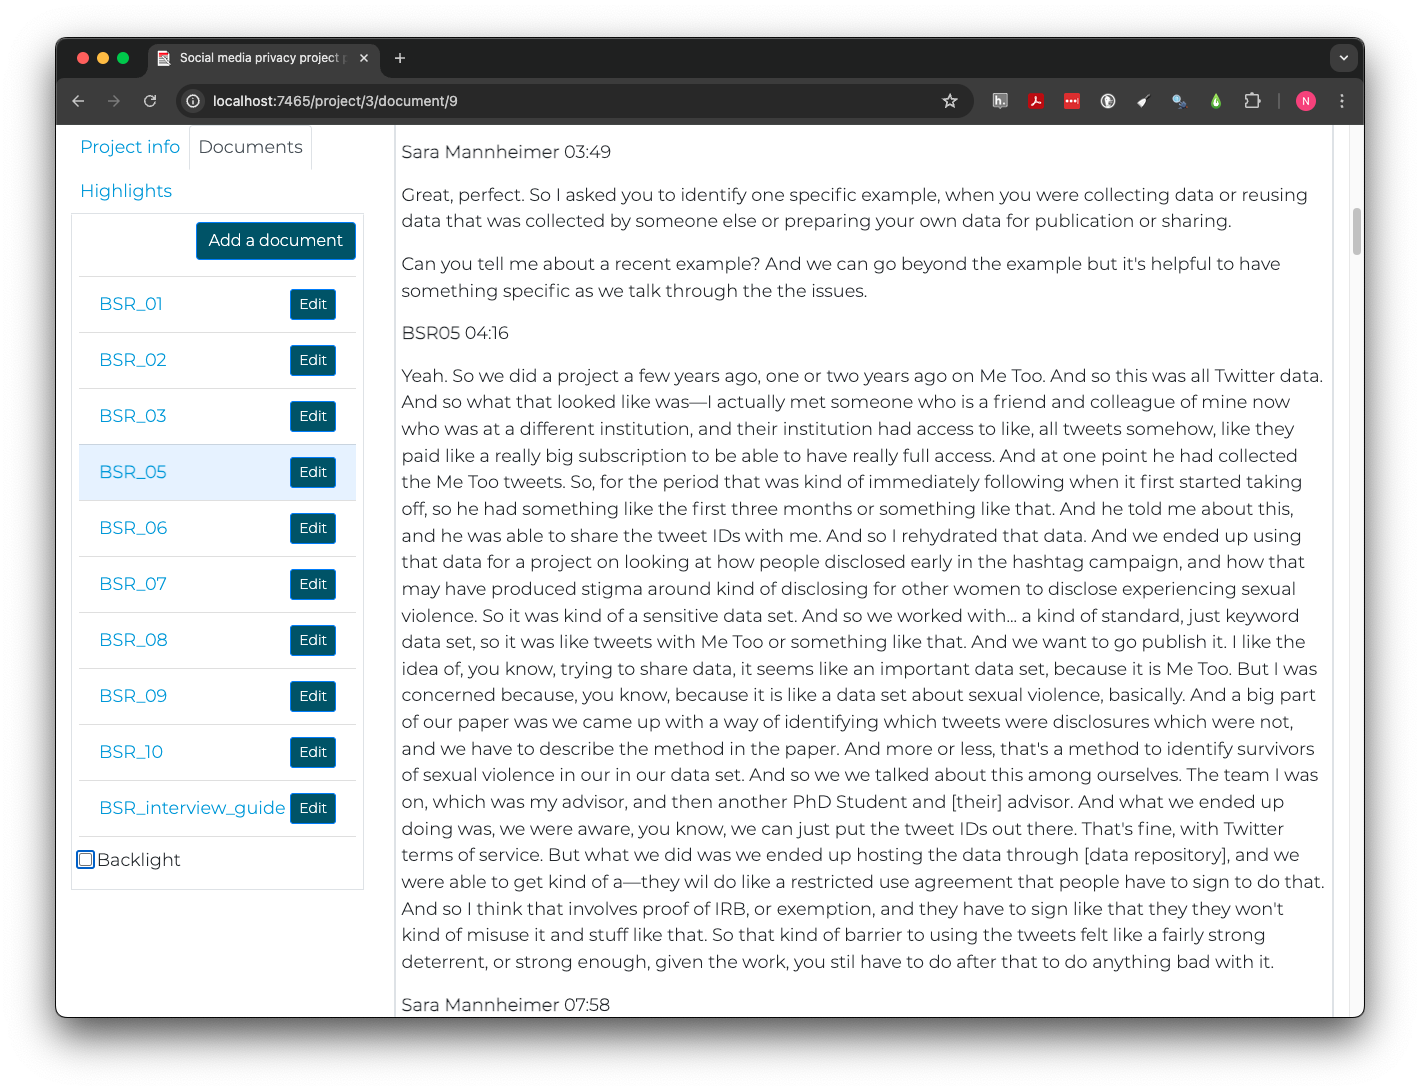
Scrolling 3 minutes and 49 seconds into the interview, we learn this person was using a large dataset of Twitter posts from the #MeToo movement with some significant privacy risks, for example:
And a big part of our paper was we came up with a way of identifying which tweets were disclosures which were not, and we have to describe the method in the paper. And more or less, that’s a method to identify survivors of sexual violence in our in our data set.
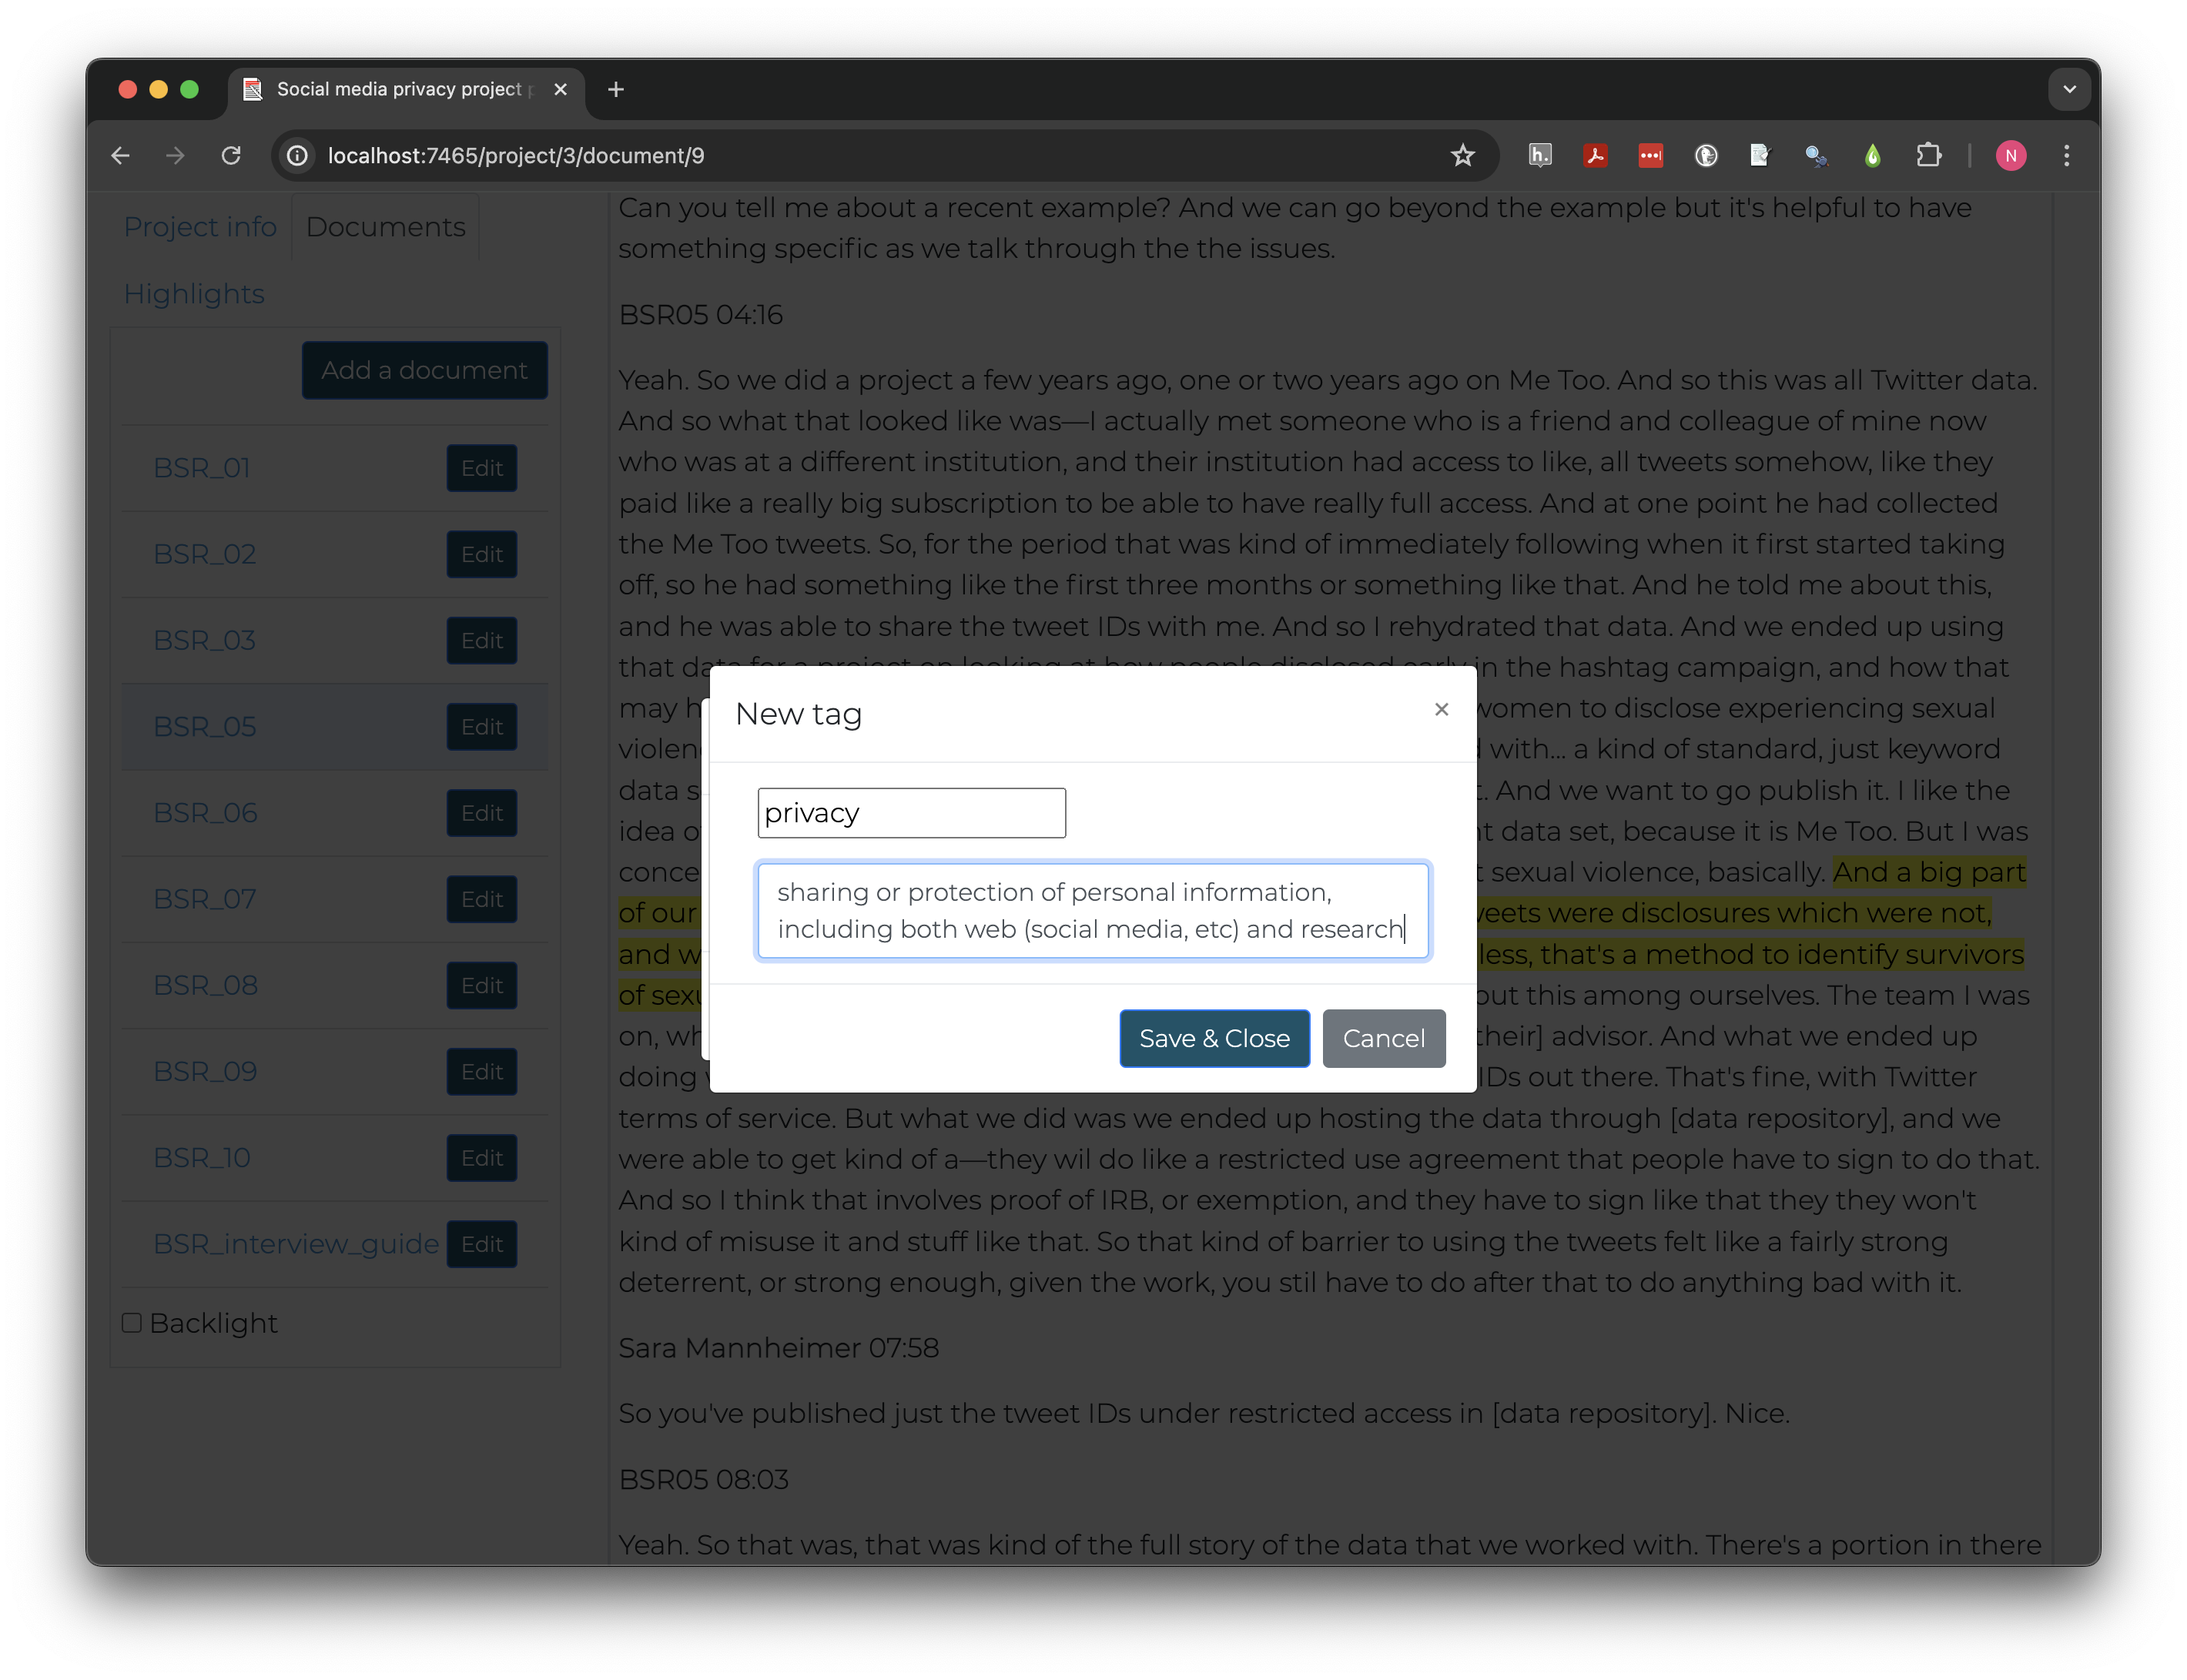
Open coding
Tags (labelled codes) are applied to highlights (text excerpts). Select the two sentences above in Taguette and click “new highlight” then check “interesting” and “Save and Close.” The text should now be highlighted in yellow.
The next challenge is flexible and can be done as a class or as a think-pair-share, where individuals spend 1-2 minutes brainstorming alone, then share with a partner and discuss, then with the class.
Creating open codes
Discuss as a class what kinds of labels you, as a social media privacy researcher, might apply to part or all of the excerpt above.
Open codes can range from very specific to more general, but theoretically fruitful codes are often somewhere in the middle - general enough to apply in multiple situations but specific enough those excerpts have something more in common.
There are multiple words or phrases that might capture some of this excerpt’s relevance for our research. Taguette allows applying multiple tags to one highlight. Doing so makes it easier to consider overlapping concepts, like “privacy” and “identity protection,” as well as other aspects of the context, such as “sexual violence” or “crime victimization”.
How much to highlight?
Taguette supports multiple tags per highlight but does not allow overlapping highlights, making decisions about how large of excerpts to use more important. Highlights generally should be only long enough to provide context and understand meaning. Some researchers always code full sentences or even paragraphs, while others make decisions case by case.
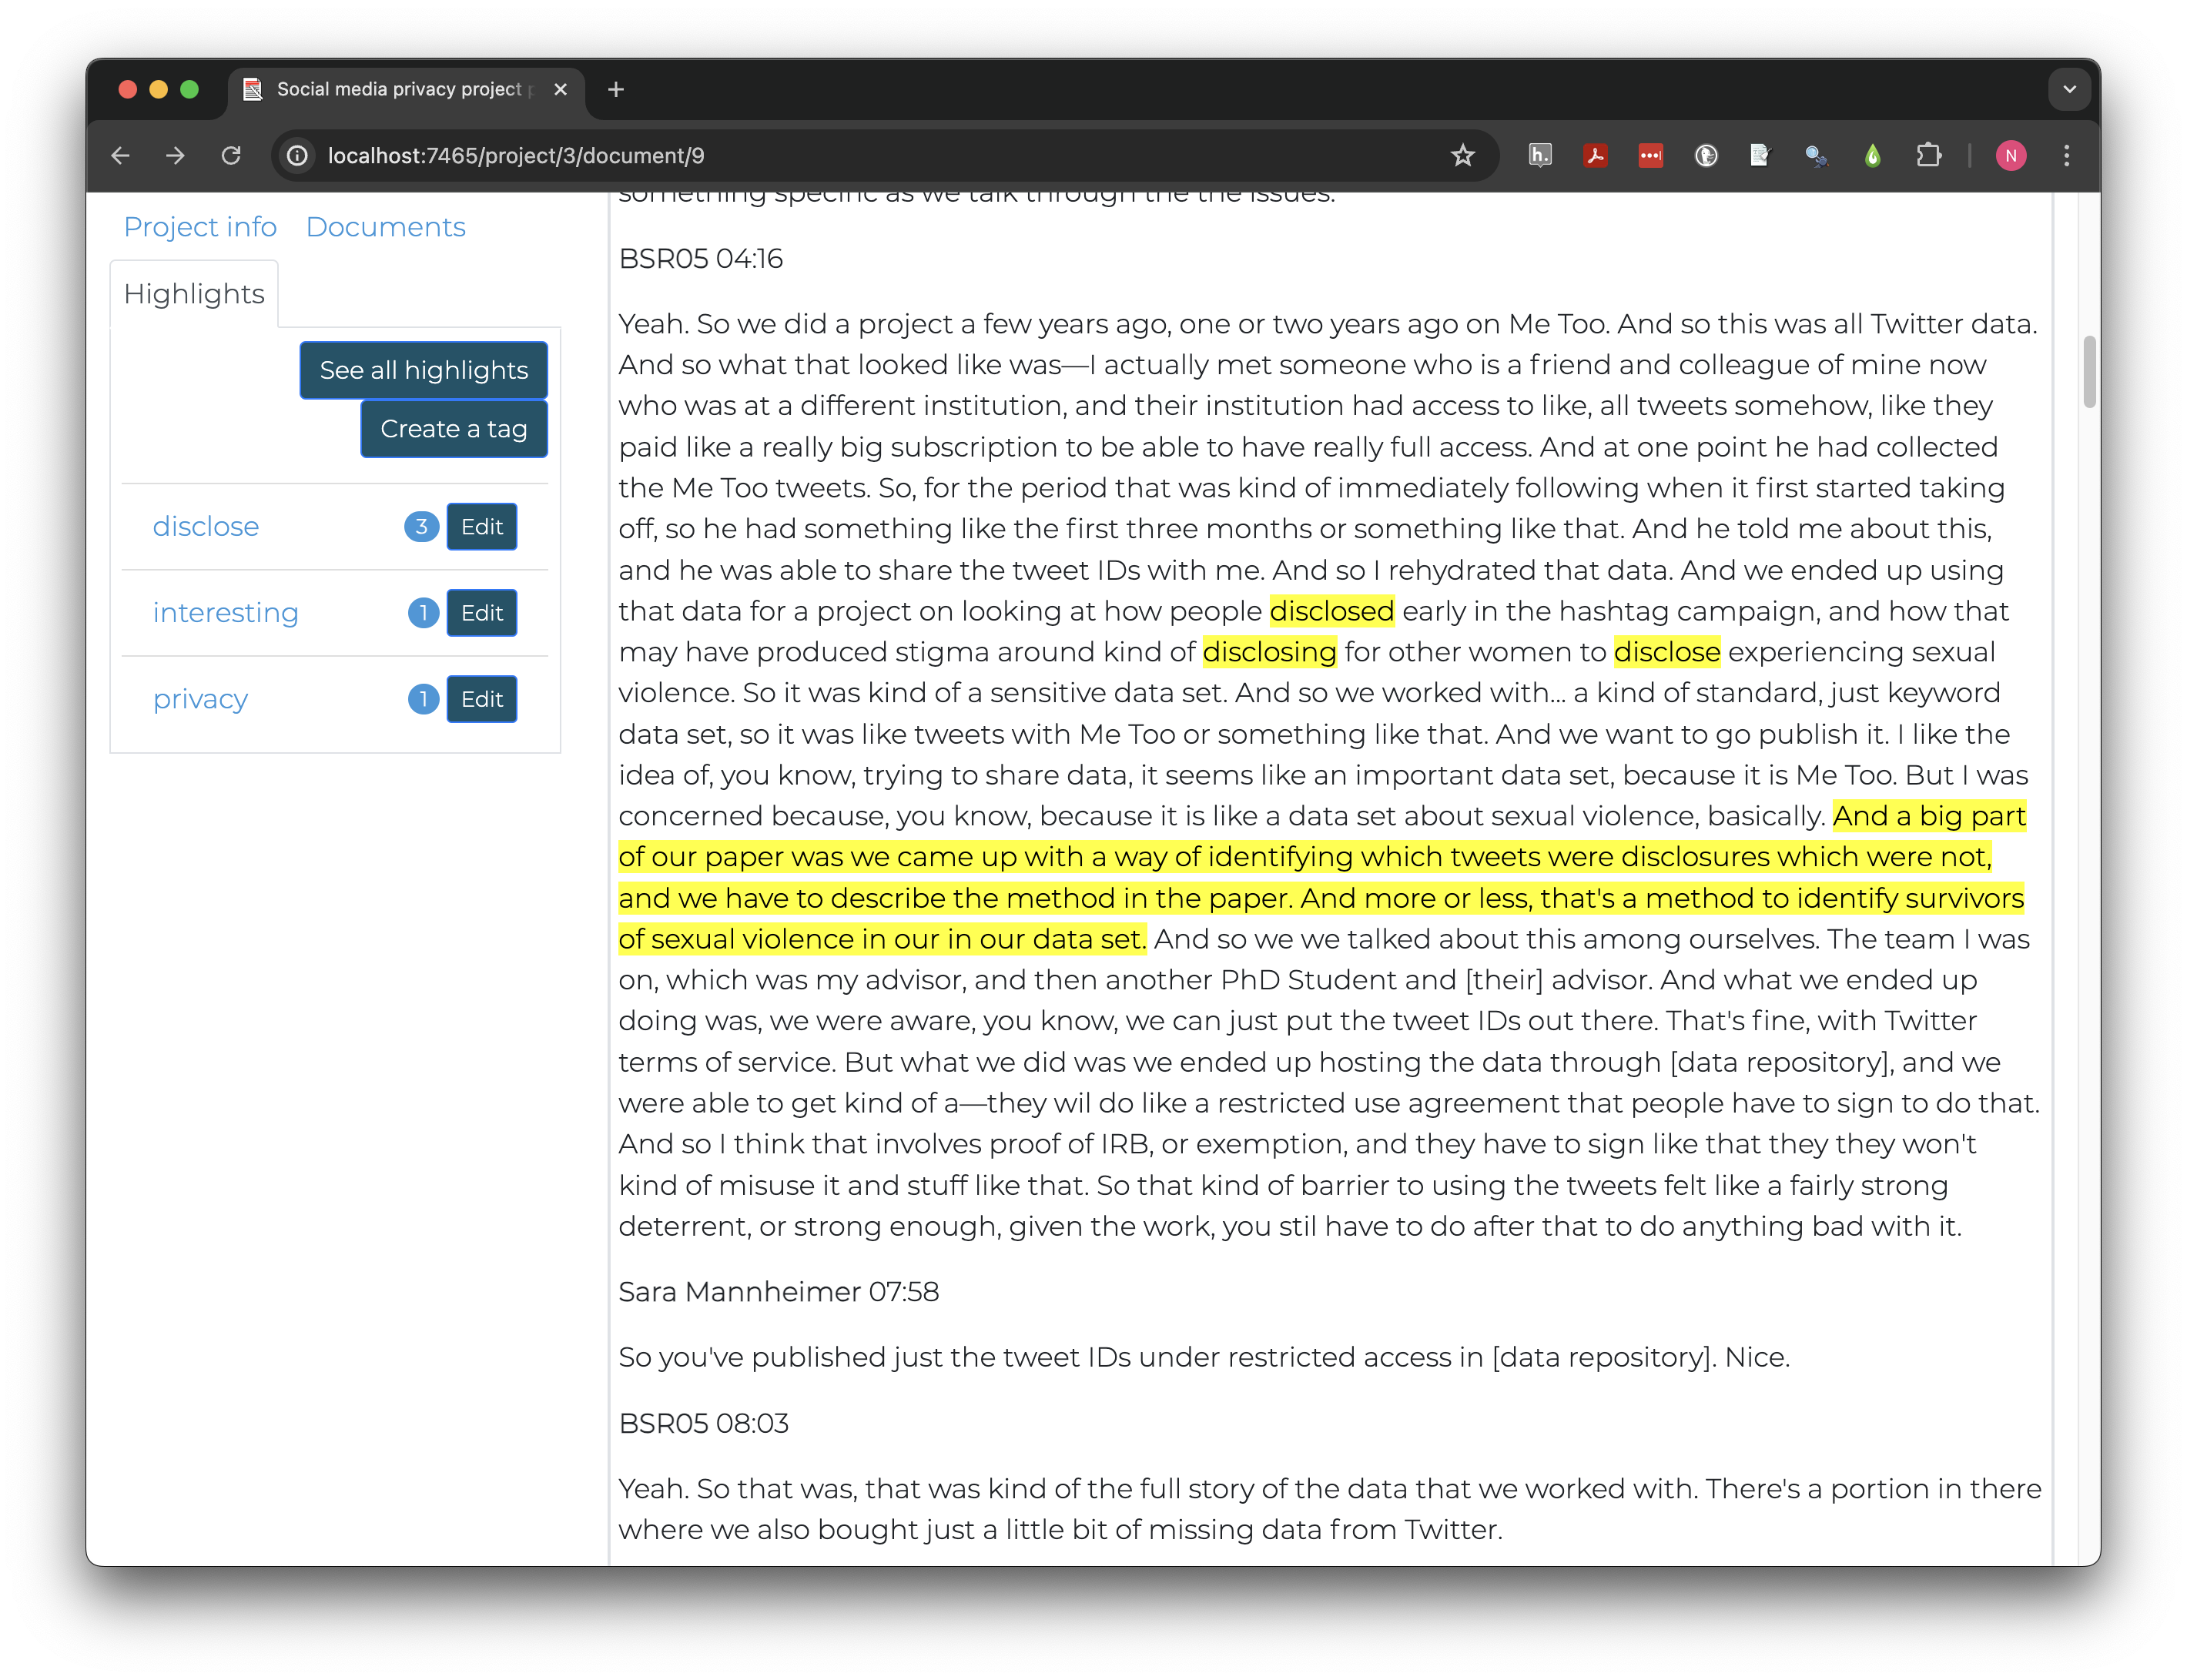
Let’s create some of the tags we defined in our discussion. Click on the highlight and create additional tags. Names should be short and clear. Adding descriptions can help clarify the difference between similar tags, especially if working collaboratively with others.
The “Highlights” tab at the left allows us to see all the tags we’ve created and to how many highlights each has been applied. I created tags for both “privacy” and “identity protection” but later realized they overlap so much conceptually they don’t need to be separated.
To merge two tags click “Edit” next to the tag you want to remove and click “Merge.” Select the other tag in the “into” box, then “Merge tags.” After merging, any highlights tagged with one or both original tag will have the name of the “into” tag and the other will be removed.
Plan twice; click once
“Measure twice and cut once.” -English proverb meaning one should plan and prepare in a careful, thorough manner before taking action and act once precisely and properly.
Taguette has no undo or history functions. Merged or deleted tags cannot be retrieved. Even if you export a copy of a project before making changes, there is no import functionality to restore the project to its previous state within Taguette.
In vivo coding
An alternative approach to inductive coding, in vivo coding, tries to further reduce researcher bias effects by creating initial code labels only from the language used in the interviews themselves.
Let’s look at a passage slightly earlier in the paragraph we’ve been working with.
And we ended up using that data for a project on looking at how people disclosed early in the hashtag campaign, and how that may have produced stigma around kind of disclosing for other women to disclose experiencing sexual violence. So it was kind of a sensitive data set.
The person being interviewed used a number of words and phrases that may be relevant to data privacy protection in these sentences including disclosed, stigma, disclosing, disclose, experience, sexual violence, and sensitive data. Rather than categorizing themes at this stage, in vivo coding retains language used by the participants.
Let’s highlight “disclosed” and apply a new tag called “disclose” to it. The same tag can be applied to “disclosing” and “disclose;” although they are different words, they have the same root word and express the same idea.
Coding trees
*Our project now combines thematic and in vivo coding in one document with no easy way to separate the types. Coding trees can help clarify and sort code groups.
Like the plants, code trees have branches, which may be types of codes or broad themes. Leaves, or specific codes or subcategories, each “grow” from one larger branch.*
Edit each tag you have created (e.g., not “interesting”) and add
either in vivo: or open: to create a code tree
where codes are sorted by coding method.
After editing tags, your project will look something like this:
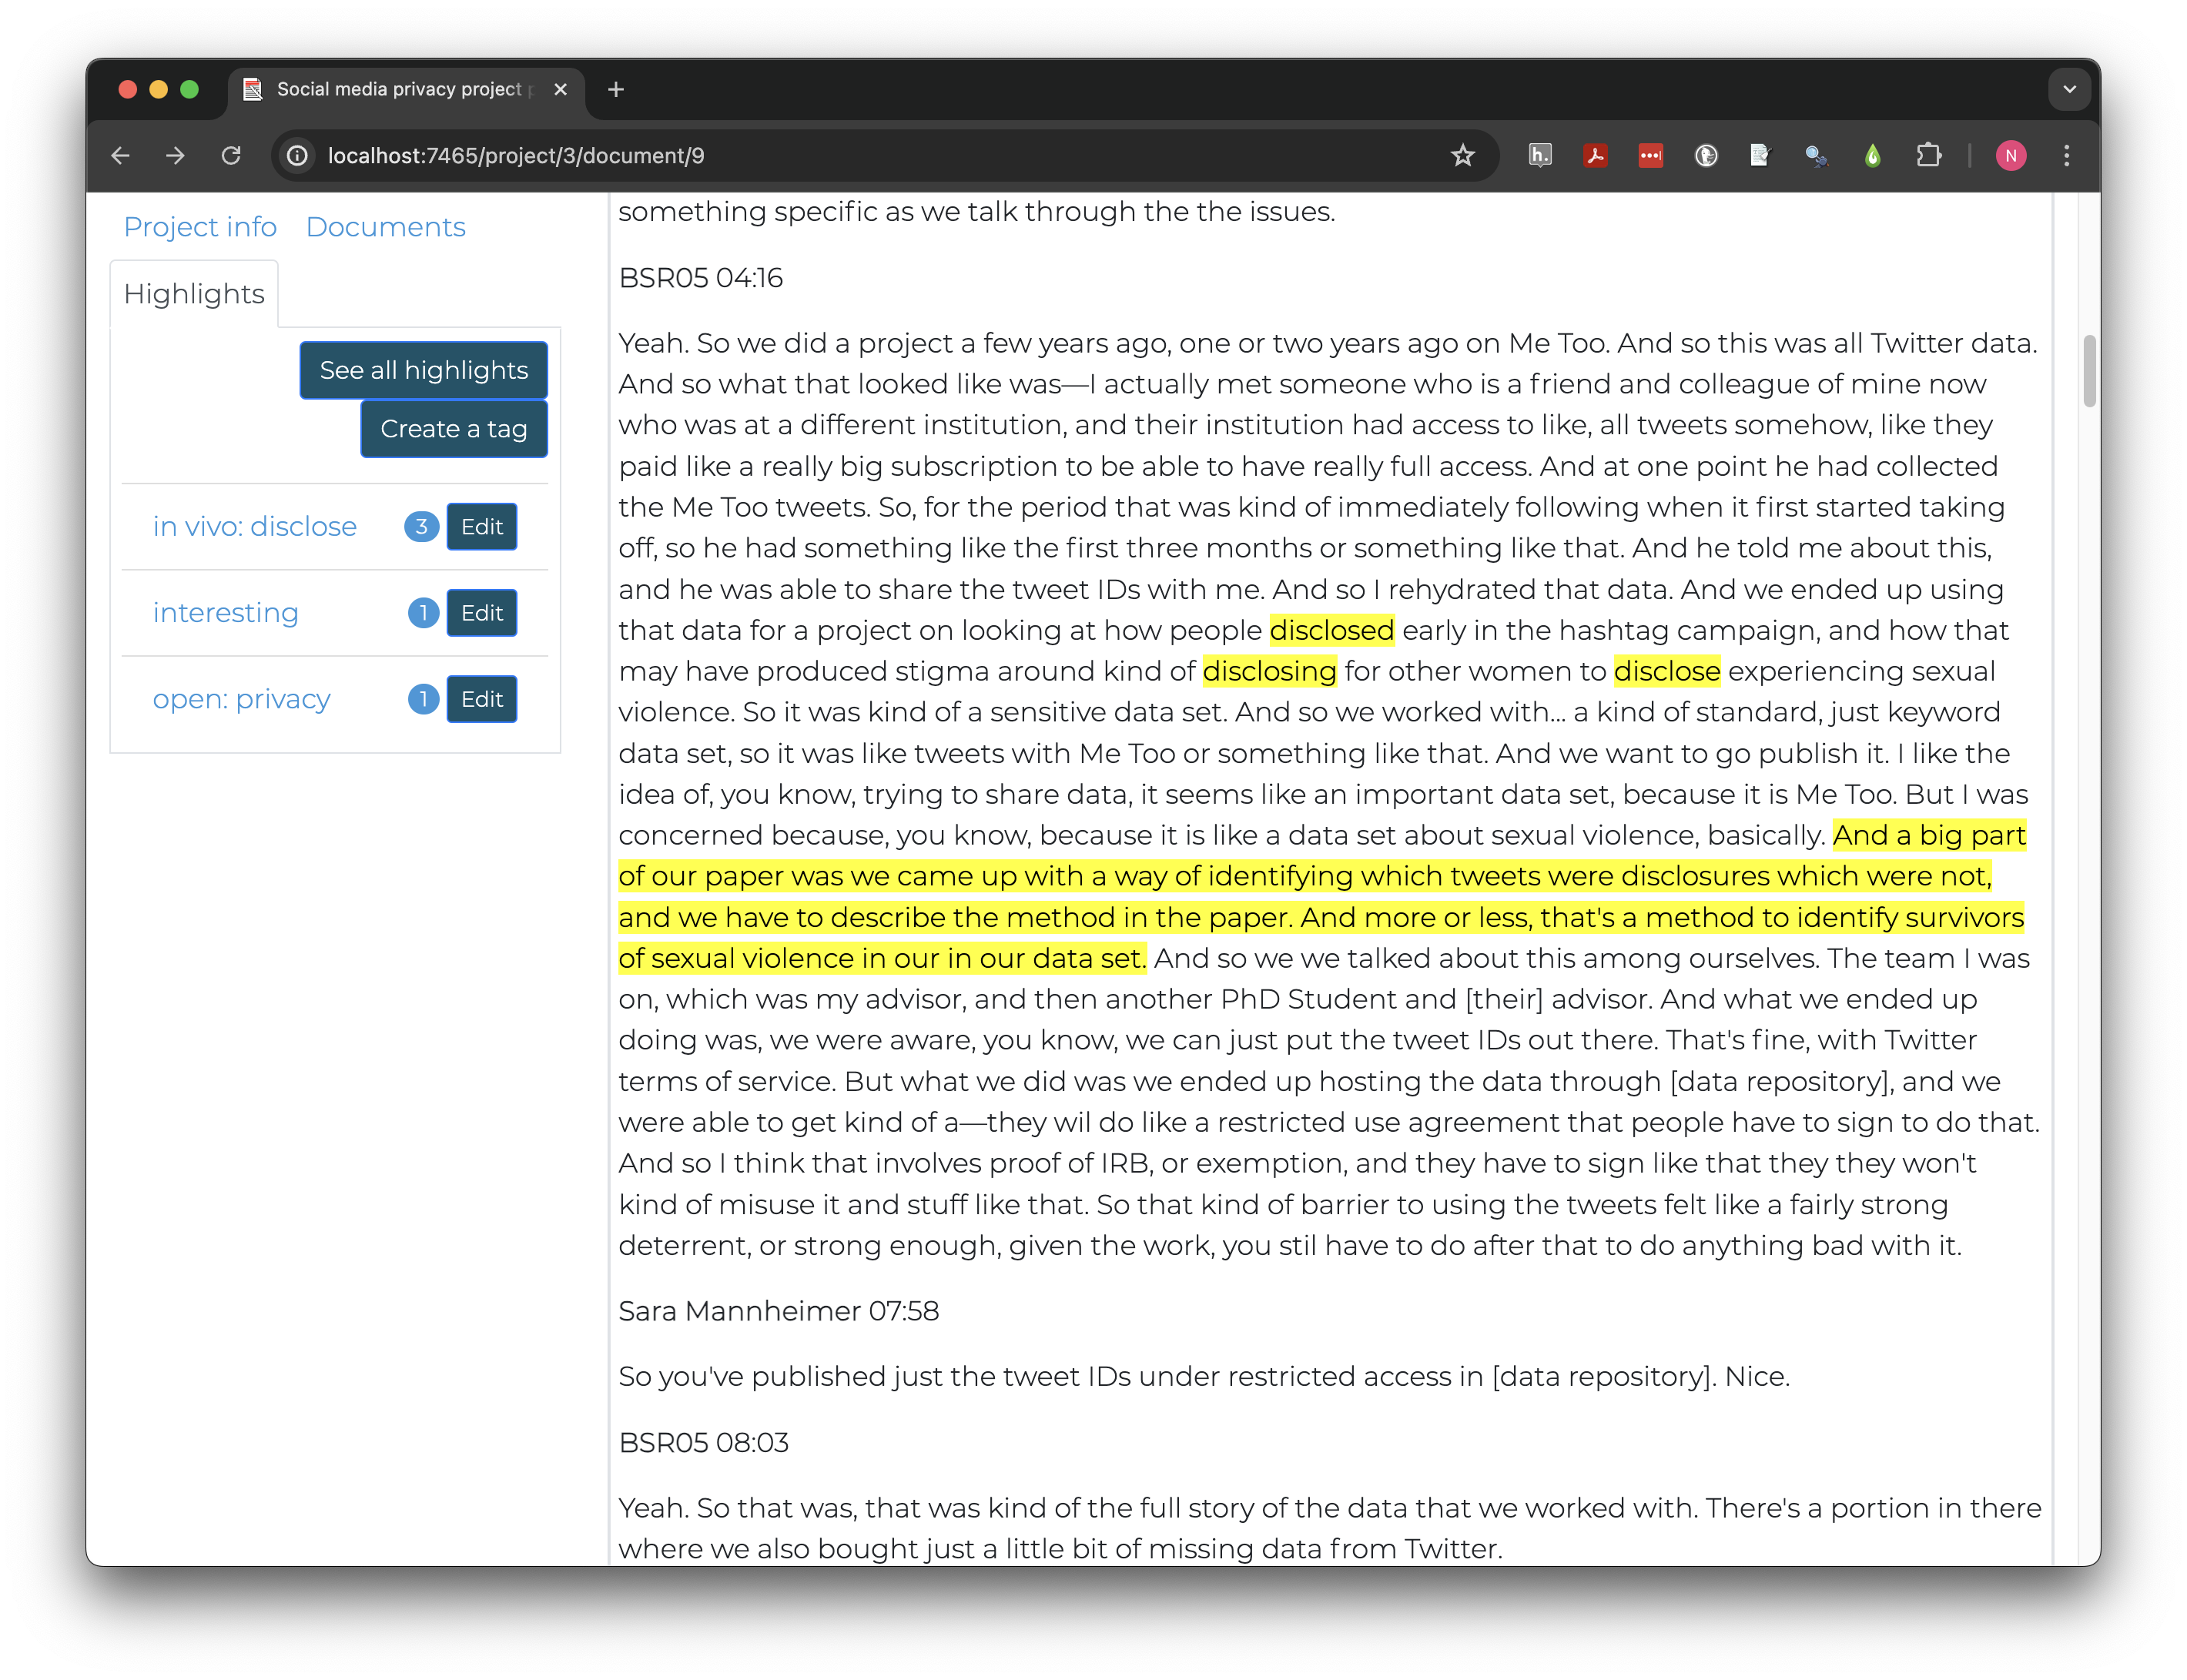
Some other qualitative software also implements dynamic code trees that allow multiple levels of nesting and automate viewing all subcodes (leaves) of a single code (branch), but embedding branches in code names is the only option currently available in Taguette.
Once applied, in vivo codes can be analyzed individually or later aggregated during the axial coding process, introduced in a later section.
Deductive coding
Deductive codes are applied much the same way as open codes, but development takes place earlier, ideally before data collection, because tags and themes reflect theories and hypotheses the study is designed to test.
Code deductively
Our research team has adapted 3 key themes from Sarikakis and Winter’s 2017 review of social media user’s consciousness of data privacy:
- Autonomy: users desire control over when and to whom their data is disclosed
- Compromise: users recognize privacy’s importance but also circumvent protections when seeking information
- Stake: concern derives from being personally affected by privacy or sharing
Create the 3 themes above as tags, prefixed by
deductive:, and add descriptions based on the background
given above.
In BSR_02, read and highlight the text block quoted
below (from the section starting at 1:44).
I’ve done some work on on Twitter on how like social people who are users of Twitter, I’ve done, did a project on on people who have been harassed on Twitter and the subject of kind of coordinated harassment campaigns, and how kind of their experiences.
In groups of 2-3 people, discuss whether each theme is relevant and why, then apply relevant tags to the highlight.
Don’t focus on finding key words or synonyms in deciding whether to apply a code. Look for sections that suggest a relationship to themes of interest.
Autonomy might apply depending on whether the harassment people experienced on Twitter included doxxing or otherwise involved personal information. Without access to the original interviewee, it’s probably not reliable enough to use in drawing conclusions.
Compromise does not seem relevant here, as the presence of online harassment suggests the advantage of stricter protections, if anything.
Stake clearly applies. The Twitter users are described as experiencing coordinated harassment campaigns on Twitter, meaning not only is the platform used to harass, but to encourage others to do the same.
Like inductive and deductive reasoning, the separation between inductive and deductive coding is rarely complete. As a researcher, how closely you adhere to a single reasoning or coding model will likely depend on personal research questions and values, as well as norms in the fields where the research will be shared.
The next challenge is designed to give learners time to practice deductive coding and become comfortable coding longer texts in Taguette, but it requires a good deal of time. Below are some recommendations for possible alternatives. Note that the some examples in qualitative data analysis rely on this. A sample project is available in the lesson repository and import instructions will be provided where relevant.
Alternative challenge options:
- Split the workshop over two days and ask learners to complete the challenge on their own time
- Split learners into groups, each of which is responsible for coding a single transcript (provide time and tools to share codes with other learners)
- Ask learners to code only one transcript or smaller sections of the transcripts
- Use the specific examples discussed in the challenge without asking learners to code the full sections (can work as demonstration or discussion)
- Omit the challenge entirely and instead ask users to import project with coded documents later (not recommended, as coding decisions are a major challenge for qualitative research)
Practice deductive coding
Practice coding documents by applying the deductive codes we
developed (autonomy, compromise and
stake) to some participant’s answers to the following
question:
Tell me about a time (if any) during the process of your example when you considered issues of privacy (e.g. protecting data during research, considering restricted access or TweetIDs only if publishing).
Apply the three deductive codes to the following interview time segments:
- BSR_01
24:33 - 29:13 - BSR_02
35:09 - 44:21 - BSR_05
33:08 - 40:57
This will likely take quite a while, particularly for those new to qualitative coding. Don’t hesitate to get the attention of the instructor or helper when you need assistance.
Read the surface text carefully, but also watch for implied reference
to themes. The excerpt below doesn’t include the word stake
or a synonym, but probably meets the definition above that stake is when
“concern derives from being personally affected by privacy or
sharing.”
BSR01 27:33 So they were anonymous in the sense that I couldn’t tie it to their real identity. But some people use this same username on all these online platforms. And that is that that is a concern. So let’s say there’s a user in my data who said something they regret, and they delete their post or their comment. It’s stil going to be there in my data set.
In fact, all three deductive codes might apply to this particular
excerpt. Part of the concern is that users didn’t have
autonomy over how their data might be connected, and the
situation resulted from compromise between wanting to share
data openly while protecting user privacy.
At other times, the label for a code may directly apply, but it may
not be relevant to how the label is being used for your research. In the
block starting at 35:58 in BSR_05, we
read:
So at the time that we collected the data, you, you couldn’t get replies to tweets through the Twitter API. So it’s like only the keyword tweets. But we’ve felt that it was really important to have replies to Me Too tweets, because that’s the conversational part. And so it kind of put us into position where the only way to get them was to do the web scraping, which is against Twitter Terms of Service, technically.
But we had conversations, that came up about whether we should use them and whether… not like whether we should tell people we use them, but like, yeah, whether we should use them in the analysis, which would affect whether like we report it in the paper or not. So like, these kind of back and forth conversations where a lot of… I guess like just walking around the ethical markers, like trying to weigh, like, this is the benefit of doing this, versus this is the cost.
So with the scraping, it’s like the benefit is—you get this much fuller picture of me too. Versus there’s potentially legal consequences here. And then with the releasing of tweet IDs, you know, the benefits of open science, being able to facilitate further research on this. Versus the cost, which is like potential harm to the participants.
This excerpt discusses a process of negotiated compromise around
whether to use data gathered in violation of the Twitter terms of
service. The code we developed, however, is specifically for compromises
related to user privacy. In this case, there was no privacy issue for
users and coding this excerpt to compromise would serve to
confuse, rather than inform, our analysis.
Not all codes will necessarily apply in each document. In qualitative research, both the content related to a topic and whether it is present at all provide data to help understand people and contexts.
If you need more context about a project to understand the section you are coding, scroll to the top of the interview where the project is introduced.
If questions in a structured or semi-structured interview were asked
in a consistent way, the easiest way to find responses to a particular
question in a transcript is to use the find tool in your
browser, typically CTRL+f in Windows or CMD+f
on Mac.
Axial coding
Most qualitative projects require more than one round of coding for a few reasons:
- The first documents rarely highlight every relevant theme. Themes and language important in later interviews may still be reflected in early interviews but less obvious before the theme was brought to the researcher’s attention. Revisiting early interviews supports consistent code application.
- Multiple coders may use tags in slightly different ways, which eventually need to be adjusted to a consistent scheme.
- Key relationships between codes may only become obvious once initial codes are considered, leading to consolidation or the development of new tags as researchers become more familiar with the documents and themes.
- When coding in vivo, people may use language differently and multiple phrases may represent a single idea.
Axial coding primarily addresses numbers 3 and 4, as it is involves relating or further breaking down primary themes or codes.
For example, the passage in BSR_05 coded to
in vivo: disclosure concerned self-disclosure of personal
information during the #MeToo movement with the hope of reducing stigma
and producing a positive outcome. But Twitter users in
BSR_02 may have been subject to disclosure of personal
information without consent. Axial coding might involve distinguishing
disclosure based on whether it was voluntary or self-directed.
Axial coding takes many other forms, depending on the research topic and methods. Deductive research may revise and further specify existing theory based on new data in their study. In vivo codes or open codes that seemed distinct may turn out to be conceptually indistinguishable. Participants may be provided summaries of initial findings and asked if they reflect their personal experience. In all cases, axial coding is a tool to clarify analysis and theory.
Qualitative studies typically have one or more rounds of initial coding, followed by any amount of axial coding necessary to represent key concepts intelligibly to both researchers and study participants.
Key Points
- Qualitative code protocols are developed based on research goals and philosophies
- Inductive research focuses on discovering or exploring themes and often uses open or in vivo coding
- Deductive research focuses on testing hypotheses and typically applies a predefined coding scheme based on theory
- In Taguette, tags are labelled codes applied to highlighted excerpts of text
Content from Qualitative Data Analysis
Last updated on 2024-07-31 | Edit this page
Estimated time: 60 minutes
Overview
Questions
- How can Taguette help analyze coded data?
- What are some common approaches to analyzing qualitative data?
Objectives
- Practice drawing conclusions about cases and themes with Taguette
- Distinguish questions answerable using cases, themes, or only in combination
By the end of coding, researchers can be quite familiar with the data. Even if they have already drawn some tentative conclusions, structured data analysis is important to validate findings, discover alternatives, and document evidence and rationales. This step increases the research’s impact and value not just for others, but for future revision or expansion of your own research.
How you can analyze your data depends on multiple decisions, including your software, the type of data you have, and how you structured your codes. But the choice of methods also depend on your research questions.
Cases
In qualitative analysis, cases most often represent individual people, like those interviewed in the BSR interviews.
You may have already done some informal case-based analysis by observing the types of privacy concerns different researchers encountered or how they went about dealing with them.
Case analysis considers the similarities and differences between individuals to help understand people holistically, including their unique contexts. In its most basic form, reading an interview is a form of case analysis. Often, researchers keep notes about individual cases, which may include summaries of relevant information and thoughts about how different themes and personal characteristics seem related in that individual’s view of the world.
Groups
A case is not always a person. It can also be a document, an organization, a news source, or another unit of aggregation whose members are categorically distinct from one another. This primarily occurs in content analysis, rather than interview and focus group research.
Brittany Shaughnessy, for example, wrote a thesis, studying gun rights messaging in the 2020 US election. She performed qualitative content analysis on Twitter posts from the official accounts of two advocacy organizations: Everytown for Gun Safety (pro gun control) and the National Rifle Association (pro gun rights).
In this situation, individual media relations personnel are not the primary interest, even if we could identify them. The purpose of the research is to compare the topics and language used by advocacy organizations with contrasting goals.
If you did not code sections of all three interviews (BSR_01, BSR_02,
BSR_05) to the three deductive codes in the previous section, you may
want to download the sample
project by navigating to Home (top bar) in Taguette and
choosing Import a project file. Click
Choose File and select the file you downloaded then click
Import project. The sample project is fully coded and will
allow you to complete the exercises in this section.
Case analysis practice
The cases we have examined discuss privacy for a variety of social and review platforms, including (interview and starting timestamp in parentheses):
- Academic peer review (BSR_01
25:03) - Wikipedia (BSR_02
35:25) - Twitter (BSR_03
33:40)
Discuss some differences between the platforms in what concerns researchers express about data privacy and the challenges of resolving them. Are there common themes that emerge across all three?
Treat this exercise as inductive and try to consider what you read as a whole, rather than focusing on the deductive themes we coded.
Click the Backlight box below the Documents
list in Taguette to grey out all non-highlighted text. This can help to
easily find sections coded as relevant for analysis.
Case analysis may be the primary focus of a study, particularly when the goal is to understand individual thought processes or group cultures.
Themes
Themes inevitably emerge when studying cases, but are ultimately considered as part of specific contexts. Thematic analysis, by contrast, focuses on how themes are similar or different across cases. Goals can include constructing general models of a concept, discovering how circumstances can impact an individual’s mental model of a concept, and testing the validity of theoretical propositions in lived experience.
Each labeled code can be treated as a potential theme, and Taguette provides a direct way to view all highlights coded to a specific tag.
First, click the Highlights tab in the top left. Then,
click the name of the desired tag. Instead of an interview, the right
pane will now display the text of each highlight coded to that tag, as
well as its document, and a list of all tags applied to the same
highlight.
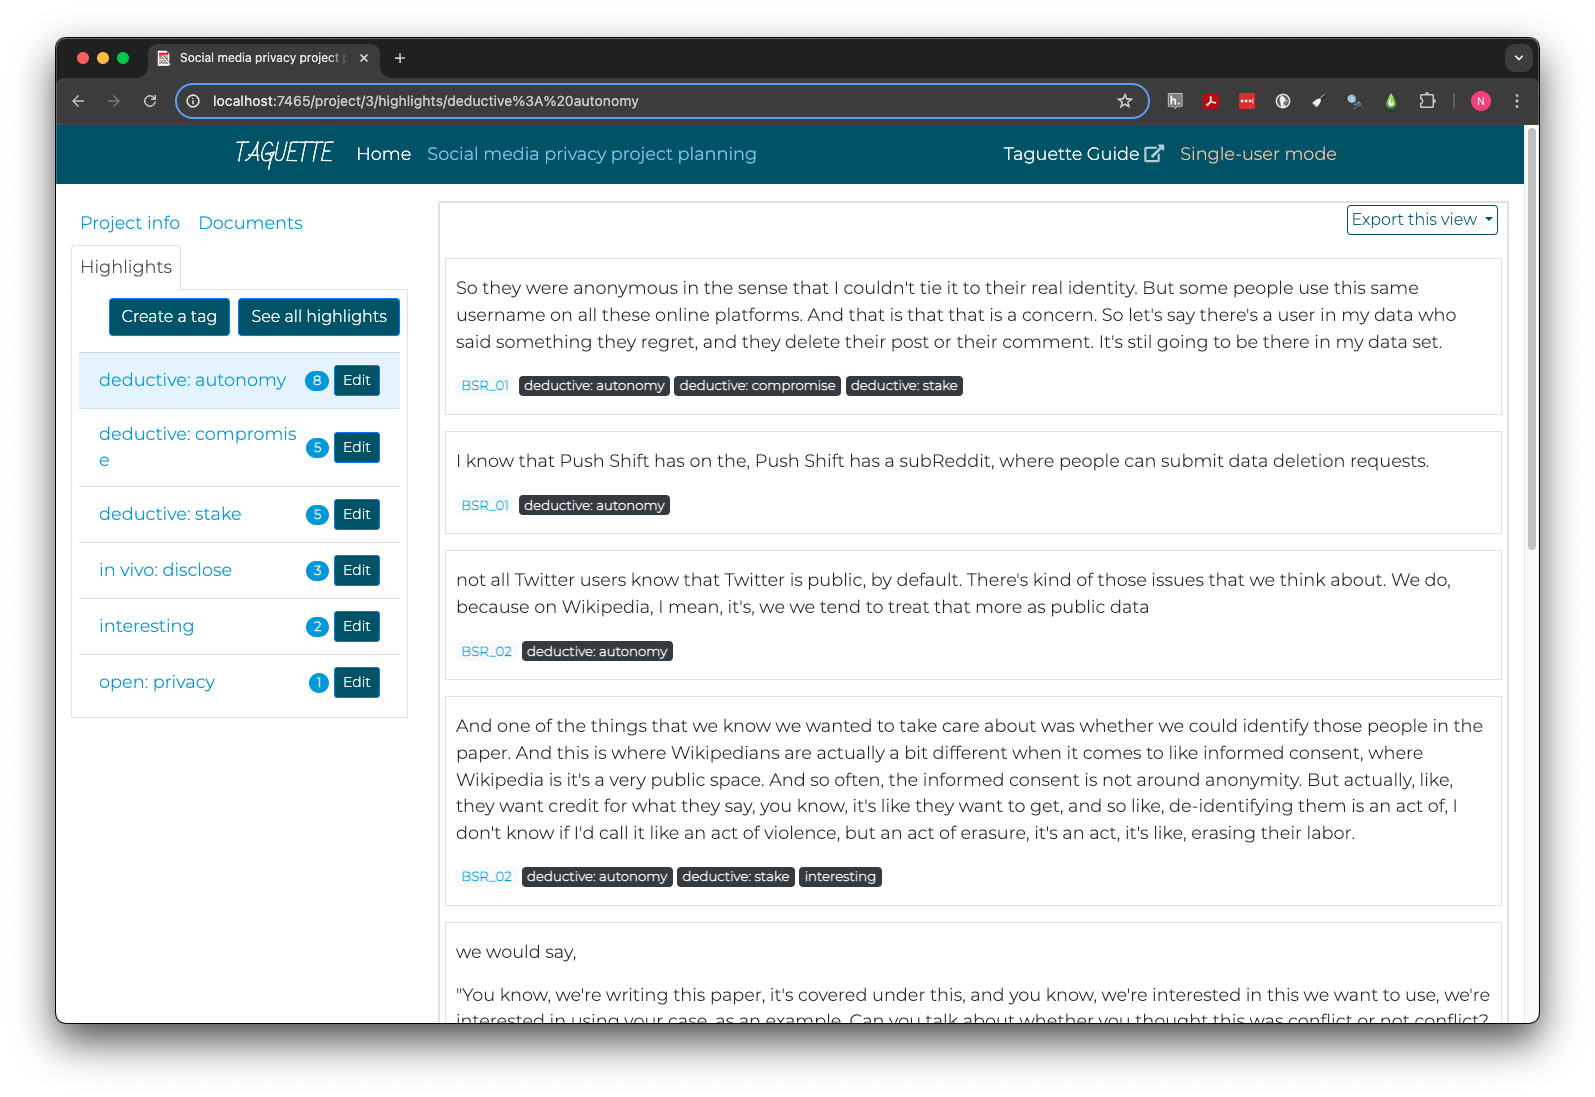
There are many ways to perform theme analysis. The tags below each highlight are interactive and allow you to quickly navigate to that document or theme by clicking, making it easier to iteratively explore the context of highlights or relationships between themes.
You may want to take notes on sub-themes or variations within a theme in a separate document. Alternately, you can add new highlights as you work more closely with individual themes, although highlights and tags can only be added after returning to document view.
Taguette also provides a count of the number of highlights to which each tag has been applied, which can give a quick sense of how ubiquitous themes are across your data. Be cautious about using such counts to draw conclusions, however. A theme may be mentioned only a small number of times but still be critical to understanding a topic or how subgroups of individuals think about that theme.
Some software also allows counting the number of times themes appear in each document or case. This, too, can provide a basic read on how widely relevant specific themes are. But again, counts cannot reveal the richness of the stories qualitative research is designed to engage, so exercise judgment before using them as a primary analytic tool.
Framework matrices
Framework matrices are a type of visual organizer some qualitative researchers use to conduct and interpret analysis. A framework matrix places one case or group in each row and one theme in each column, with the themes related to a single overarching framework. Once the table is set up (on a computer or by hand), the researcher fills each cell with one or more quotes or summaries that encapsulate that theme for the case or group.
This process is undertaken systematically, following these steps outlined by Laurie J. Goldsmith:
- Data familiarization
- Identifying a thematic framework
- Indexing all study data against the framework
- Charting to summarize the indexed data
- Mapping and interpretation of patterns found within the chart
The table below is an abbreviated example of what a completed framework matrix might look like, using the coding undertaken in the last episode:
| autonomy | compromise | stake | |
|---|---|---|---|
| BSR_01 | Anonymous data linked to usernames might still be connected to other platforms | Releasing data with public usernames is allowed and anonymous but could be reidentified | Misrepresentation in data sharing can hurt or offend subjects, even when the misrepresentation is faithful to the research topic |
| BSR_02 | Expectations and knowledge of control differ by platform, and users vary in their reasons and desires to share or hide their interactions | Removing identifiers from shared data and paper but not raw analysis protects privacy but prevents reproducibility and transparency | there is sometimes a personal stake in having data shared or credited rather than having it kept private |
| BSR_05 | The scale of big social data can mean reidentification would be easier with existing public data than datasets, as long as direct discovery pathways like Tweet ids are omitted | NA | Data related to sensitive disclosures, even if they were made publicly, may need to be protected for compelling interest such as safety |
Much of the work of analysis and theory-building is part of creating a framework matrix, and so, by the time you finish, you’ll likely already be much closer to answering research questions. That said, there are also advantages to working with a framework matrix during the analytic process, as well as their utility as a summary tool for others.
Reading across columns, within a line, on a framework matrix allows for analyzing cases. Reading down rows, within a column, allow for thematic analysis. And having both summarized together opens up options to study how clusters of cases may share similar approaches to themes. This kind of intersectional analysis can be done informally, or can be used to create formal case classifications or thematic typologies to stimulate further theory-building and research.
Sentiment and degree
Sometimes, particularly when considering deductive hypotheses, it is not enough to code only for the presence or absence of a theme. In such situations, semi-quantitative coding may be applied in one of at least two ways.
Sentiment codes indicate whether the feeling or attitude expressed in an excerpt of text is positive, neutral, negative, or mixed in relation to a theme. Neutral and mixed can be hard to distinguish. Neutral sentiment is generally unbothered about good or bad in relation to something, while a mixed sentiment includes both positive and negative feelings, often toward different aspects or implications.
In the excerpt below from BSR_02, certain Wikipedia
contributors are attributed a negative sentiment toward contribution
disclosures, which might also be framed as a positive sentiment toward
privacy.
Some of them like hold ideological views that are against like the counting of contributions. And they’re just like, “I don’t believe that that’s something we should be doing. And so I want to remove myself from this list.”
Sentiment codes can be applied in the same way as other codes, for
example with a tag for sentiment: positive. They work best
when applied to the same highlight as a single thematic code, so there
is no ambiguity as to which theme is associated with the sentiment.
An alternative way to integrate degrees of valuation into qualitative
coding is to code on a scale. For example, the amount of stake that a
sexual assault survivor has in protecting their identity from disclosure
is higher than that of a Wikipedia contributor who wishes to remain
anonymous to avoid attention. Scales typically are numeric with a
relatively small number of rating points, such as a three-point
Low, Medium, High scale.
Occasionally, qualitative data also asks about specific quantitative measures that may have more natural units, such as a study of childhood reading experiences that asks about how many minutes a day each parent reads to their child.
Taguette provides no option to attach a numeric rating to a tag. It is again possible to create a separate set of codes to capture ratings, as described above for sentiment, but many full-featured paid CAQDAS packages provide native ratings functionality.
Key Points
- Case analysis focuses on the unique situation of each person or group
- Theme analysis focuses on how the study population perceives or discusses themes or ideas
- Framework matrices are a formal method to combine case and theme analysis using a visual organizer
- Information on sentiment, degree, or quantity can also be encoded for qualitative analysis
Content from Saving and Sharing Qualitative Data
Last updated on 2024-07-31 | Edit this page
Estimated time: 60 minutes
Overview
Questions
- How can Taguette projects be shared or archived in common data formats?
- What are the advantages of sharing qualitative data?
- What can I do to continue learning?
Objectives
- Recognize reasons to consider archiving or sharing qualitative data
- Practice import/export of various parts of Taguette projects
Many qualitative researchers prefer not to share or archive their data and analysis. In large part, this is because of the amount of interpretive labor they invest, along with frequent direct trusted connections with groups and individuals being studied. This trust can take time to develop before and during data collection, whether as participants or observers.
There are important advantages to archiving and sharing data, however, even for qualitative data. Each researcher ultimately must make their own decisions, but this final section will outline potential values and risks of archiving or sharing data, as well as how to go about doing so in Taguette.
Callout
Data sharing and interchangeable data formats have only recently become someone widespread in qualitative research. Be aware that information in this section may rapidly become out of date, and if in doubt, consult with a human subjects protection board, archivist, or librarian at your institution or the Qualitative Data Repository before sharing data.
Import and export in Taguette
Taguette projects are automatically saved either to the cloud or your
local computer, depending on whether you use the local
Single-user mode or sign into [Taguette Cloud][taguette_cloud.
Projects and codebooks can both be exported and imported in Taguette.
Projects exported from the Project info tab are saved as
sqlite3 databases. They’re designed primarily for personal
archiving and sharing or moving between cloud and local versions, so
they work best if opened in Taguette. There is no tool currently
available to automatically convert a Taguette project to a format
compatible with other CAQDAS, although sqlite3 is an open
database format. This means the data can be accessed using other
compatible software even if Taguette is no longer usable, although
databases are not designed for qualitative analysis off the shelf.
To import a previously-exported project in Taguette, click
Home at the top to exit to the projects list. From there,
click Import a project file, find the file you saved, and
import. All documents, highlights, and tags should be intact.
Other qualitative data formats
Each major CAQDAS package has its own proprietary data format, specialized to its features. In most cases, projects cannot be moved between software in these formats, Taguette’s included. Data files in some software may also be restricted to specific platforms (Windows or Mac) or software versions.
The REFI-QDA standard
offers an alternative, the QDPX format. QDPX
was developed in collaboration between researchers and major package
developers, that provides the ability to move projects in a standard
format between every major package. It is an open standard which anyone
can use and adapt. Because packages structure data differently and have
distinct advanced feature sets, some data may fail to import into the
target tool.
Taguette currently only implements the codebook portion of the
QDPX standard, and only for export. To export a codebook
that can be imported in other software, choose
Export codebook from the Project info tab and
select QDC (XML).
Data sharing for collaboration
Working with collaborators is one of the most common reasons for
sharing qualitative projects. The most direct option for sharing
Taguette projects with collaborators is to use Taguette Cloud. From the
Project info tab, Manage collaborators allows
you to add other users (they need to sign up first) and select the level
of permissions they have to view, change, or even delete the
project.
Sometimes, however, you only want to share a specific portion of the
project with collaborators. The document or highlight view can be
exported with the dropdown at the top right in HTML
(webpage), DOCX (Word), or PDF (Adobe) format.
Unlike sharing the original document, exporting this view, will show
highlights and add tags in brackets so collaborators can see what codes
have been applied.
Highlight view behaves similarly, with the addition of a
CSV format that can be opened in Excel or other spreadsheet
or data analysis software.
Finally, a codebook can be automatically generated from the
Project info tab that lists code labels, the number of
highlights they have been applied to, and any description added to the
codes. Formats include all those listed above, as well as
QDC XML format (see “Other qualitative data formats”
above).
Transparency and reuse
Certain scientific disciplines have called for research transparency, including sharing data and analytic procedures, with momentum growing in many social sciences. Until recently, that effort was primarily applied to quantitative data, such as surveys, experiments, and “big data” gathered from the internet.
A small number of projects are working to change that perception and
promote the thoughtful, informed, careful sharing of qualitative and
mixed methods data as well, led in part by the Qualitative Data Repository and enabled
by improvements in sharing like the REFI-QDA standard.
Helping future you
If the arguments above don’t convince you that it’s good and worth the effort to archive qualitative data securely, there is one more important case to be made.
Archiving your data in an open and interchangeable format that is backed up in multiple locations can help future you. If your only copy of your project is on your laptop and it is lost or destroyed before analysis and review are complete, or if you decide you want to do additional analysis later, there isn’t much that can be done short of repeating a large amount of work.
Taguette’s single-user mode only stores data on your computer, and Taguette Cloud only saves it to the Taguette servers, which could go down at any time. Whether or not you plan to share or reuse your data, consider exporting your project from Taguette at key points, such as after you’ve completed initial or axial coding.
Next steps
This lesson has covered basic principles of qualitative research, as well as how to use Taguette for qualitative coding and data analysis. With that foundation, the next step is to find or collect your own data and try it for yourself.
In addition to the Qualitative Data Repository (used and discussed here), some other social science data archives such as ICPSR have qualitative sections. For qualitative content analysis, there are thousands of open-access archives of documents, research, education resources, and even entire books.
Key Points
- Archiving and sharing qualitative data can help you, your collaborators, and other researchers
- Taguette’s import and export options can help you share key components of your work
- There are many resources available to continue learning about qualitative research and finding, reusing and sharing qualitative data